

[2022年更新]合格できるTableau Desktop-Specialist日本語プレミアム資料テストエンジンPDFの無料問題集お試しセット
2022年最新のリアルDesktop-Specialist日本語問題集テストエンジン試験問題はここにある
質問 14
SUMはテーブル計算ですか?
- A. いいえ
- B. はい
正解: A
解説:
Explanation
SUM is an aggregate function, not a table calculation!
A table calculation is a transformation you apply to the values in a visualization. Table calculations are a special type of calculated field that computes on the local data in Tableau. They are calculated based on what is currently in the visualization and do not consider any measures or dimensions that are filtered out of the visualization.
The most common Table calculations are:
Running Total
Percent Difference
Difference
Percent of Total
Rank
Percentile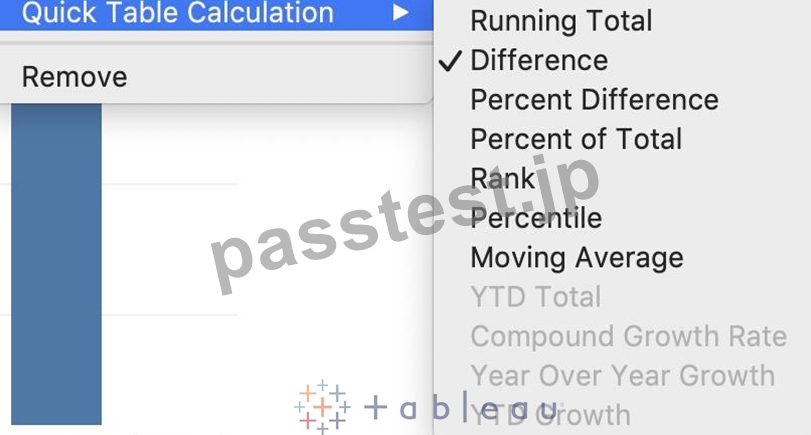
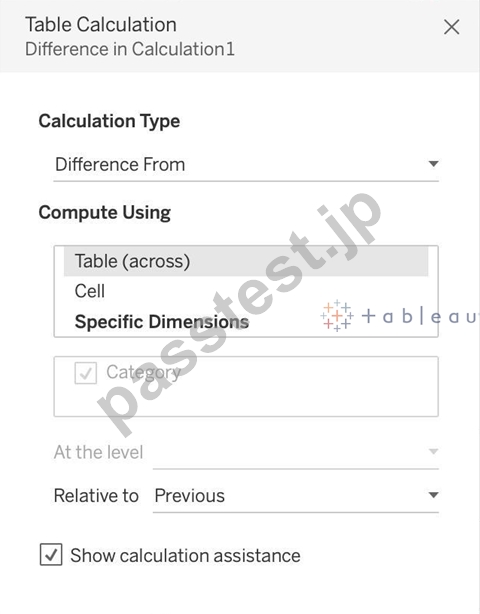
These can be calculated using : Table(across), Cell, or Specific dimensions!
質問 15
スキップされたアイテム番号ID列の地理データと時系列テーブルに参加し、マップ上のすべての州のストア数を表示します。テキサス(TX)の2017年の店舗数はいくつですか?
アイテム番号ID列の地理データと時系列テーブルを結合し、マップ上のすべての州のストア数を表示します。テキサス(TX)の2017年の店舗数はいくつですか?
- A. 336,908
- B. 416,702
- C. 293,202
- D. 592,593
正解: B
解説:
Explanation
Since you need BOTH State and the YEAR, we need to use an Inner Join.
Follow the steps below:
質問 16
Tableau 2020.1で導入された新機能ではないものは次のうちどれですか?
- A. コントロールを設定
- B. バッファ計算
- C. Vizアニメーション
- D. 動的パラメータ
正解: A
解説:
Explanation
Your Tableau Desktop Specialist exam will be based on the 2020.1 version.
Set controls are a new feature introduced in the 2020.2 version, and hence is the correct answer - it is not a part of 2020.1 For the 2020.1 version the new features were:
1) Viz animations:
Viz animations help you see and understand your changing data. It's easy to track the logical steps behind data's evolution and tell powerful data stories. Sorting, filtering, adding fields, and other actions will now smoothly animate your visualizations. Choose whether to turn Viz Animations on or off, and decide how you'd best like to apply animations to your new workbooks.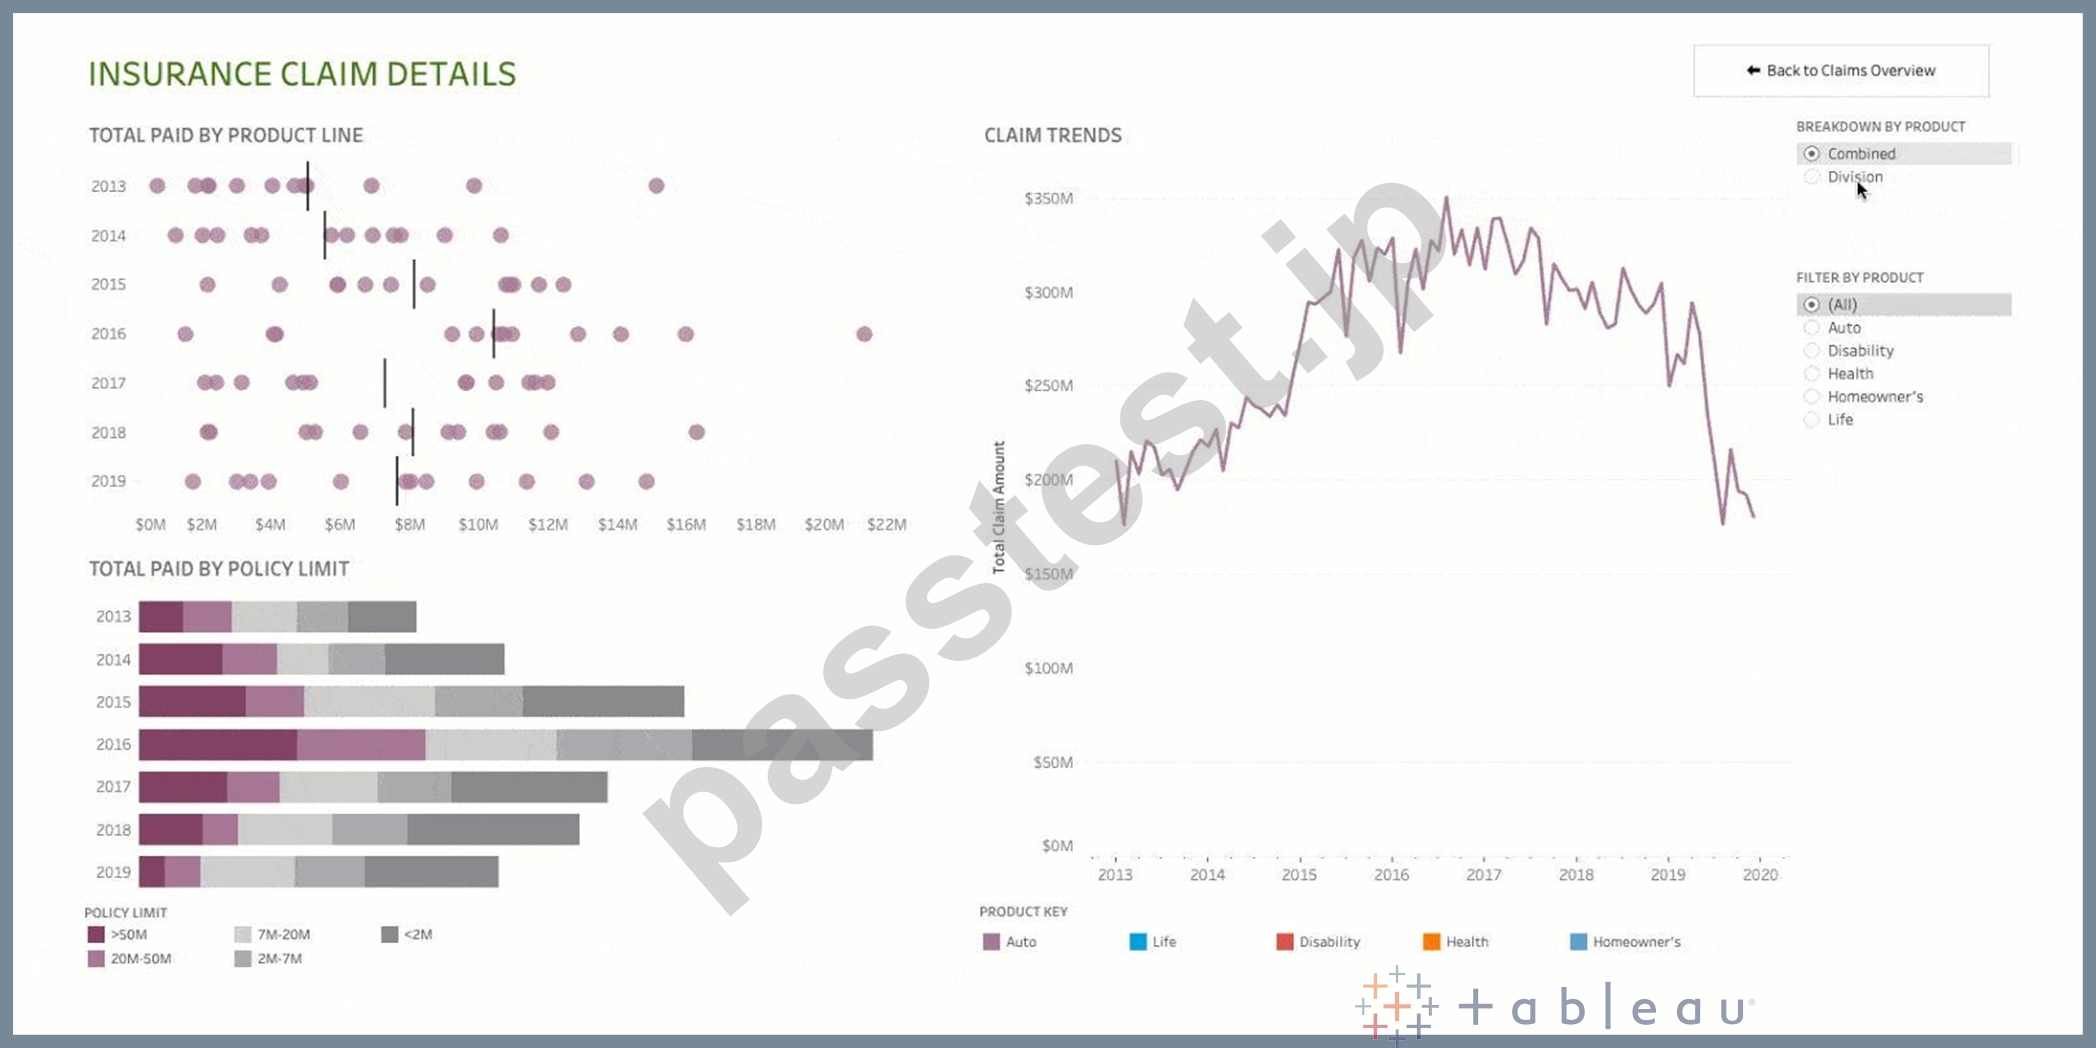
2) Dynamic Parameters:
Say goodbye to republishing workbooks with parameters every time the underlying data changes. Set your parameter once, and Tableau will automatically update the parameter's list of values every time someone opens the workbook.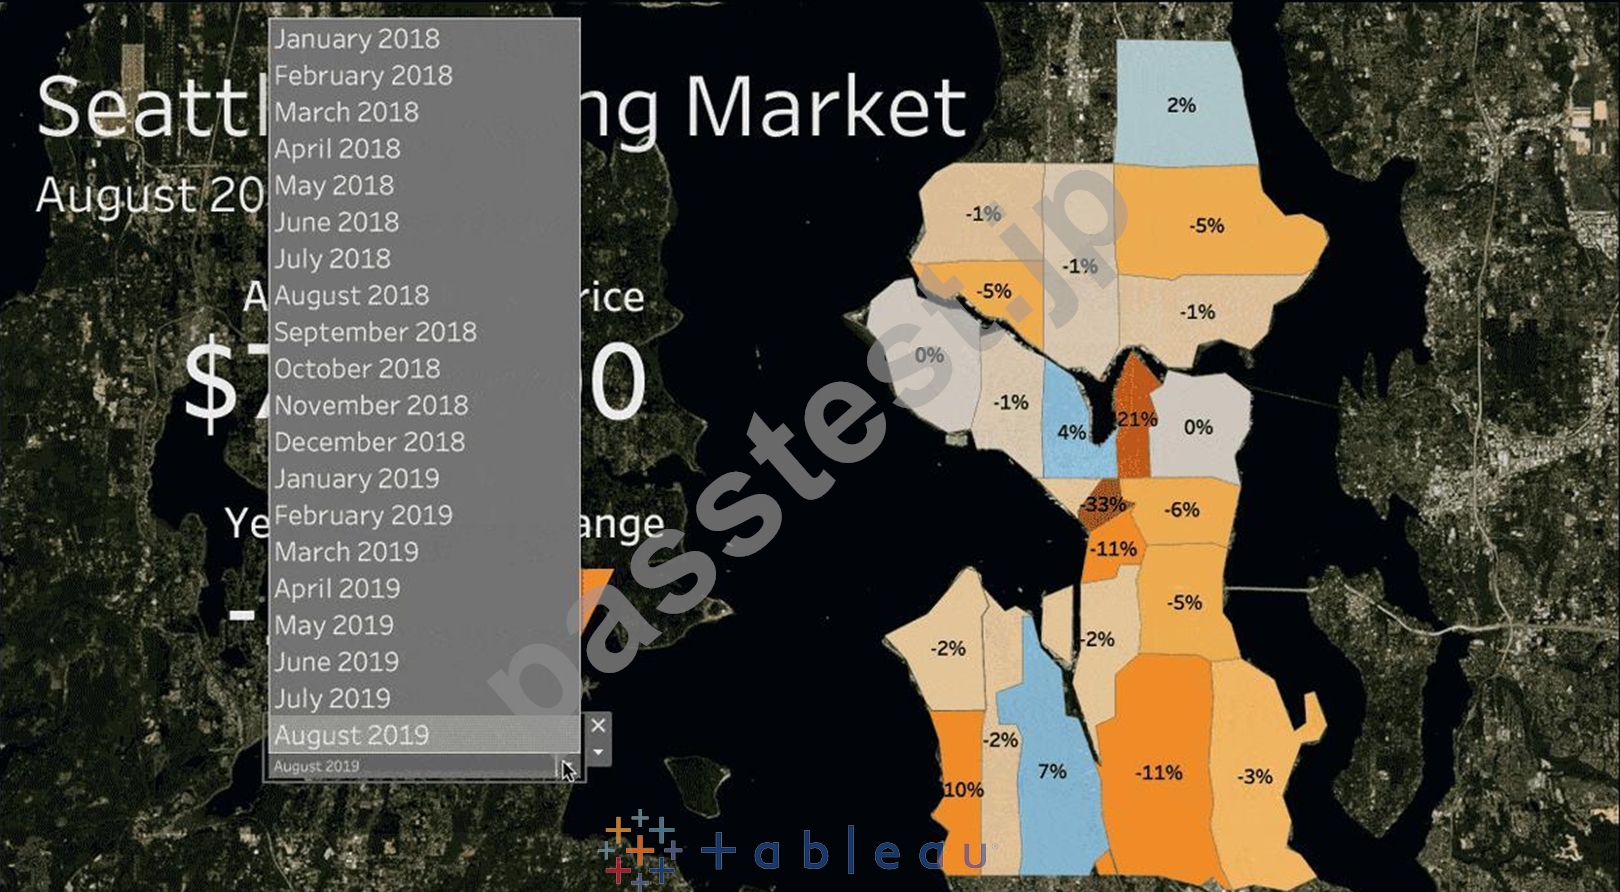
3) Buffer Calculations: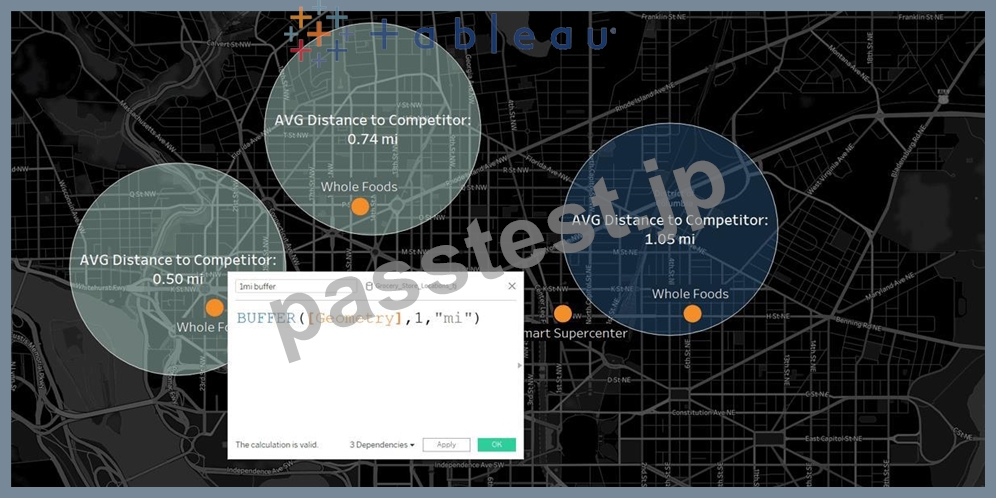
Buffer calculations allow you to visualize the distance around point locations. Give Tableau three parameters-location, distance, and a unit of measure-and a buffer, or boundary is instantly created.
Answering complex spatial questions becomes easier than ever before-visualize what properties are within
200 meters of a proposed transit site, or how many competitors' stores are within 1 mile of their store, and more.
質問 17
Tableauのビューのマークに色を追加するにはどうすればよいですか?
- A. 列/行のシェルフで、フィールドを右クリックし、[シェルフで編集]をクリックして色を選択します。
- B. [分析]ペインから、モデルを[マーク]カードの[色]にドラッグします。
- C. 上のメインメニューの[データ]をクリックし、[色の選択]をクリックします。
- D. [データ]ペインで、フィールドを[マーク]カードの[色]にドラッグします。
正解: D
解説:
Explanation
To assign a color to marks in the view, do the following:
From the Data pane, drag a field to Color on the Marks card.
Tableau applies different colors to marks based on the field's values and members. For example, if you drop a discrete field (a blue field), such as Category, on Color, the marks in the view are broken out by category, and each category is assigned a color.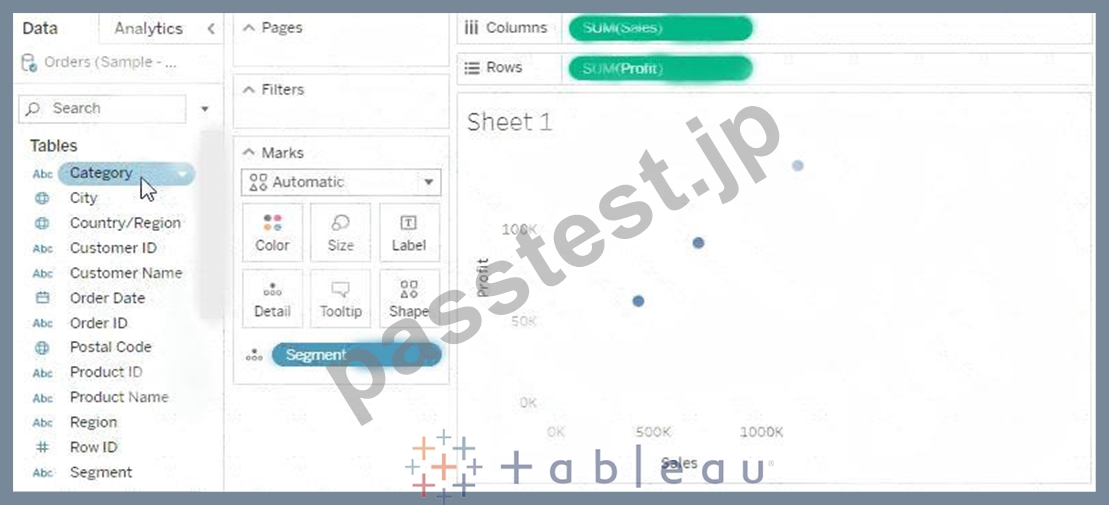
If you drop a continuous field, such as SUM(sales), on Color, each mark in the view is colored based on its sales value.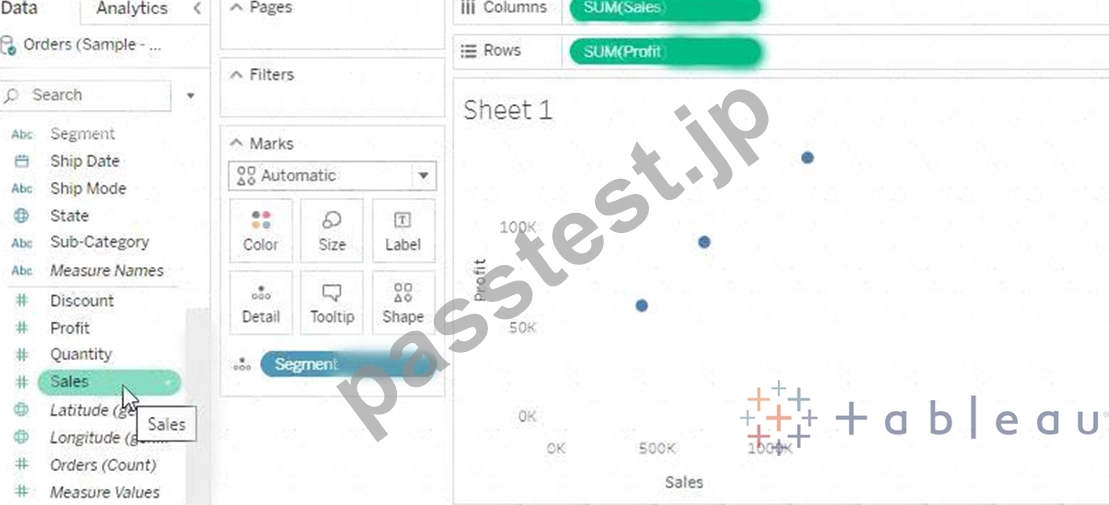
質問 18
ビジュアライゼーションの形状、色、テキストを編集するために使用するのは次のうちどれですか?
- A. マークスカード
- B. データペイン
- C. 分析ペイン
- D. フィルターシェルフ
正解: A
解説:
Explanation
The Marks Card allows us not only to edit the Shape, Text and Colour, but also to modify the Tooltip and the level of detail of the visualisation!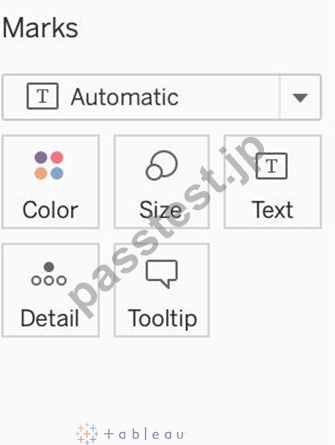
The Marks card is a key element for visual analysis in Tableau. As you drag fields to different properties in the Marks card, you add context and detail to the marks in the view.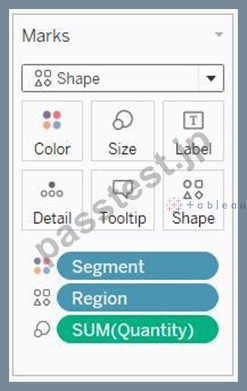
You use the Marks card to set the mark type (see Change the Type of Mark in the View), and to encode your data with color, size, shape, text, and detail. To change the mark settings, see Control the Appearance of Marks in the View.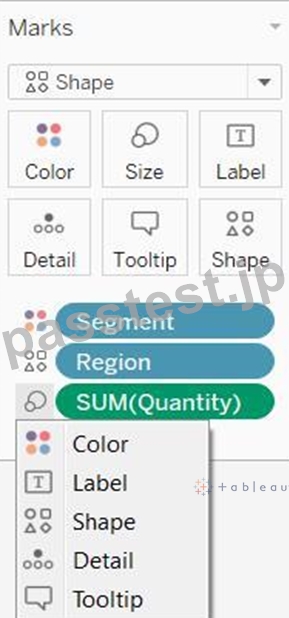
In this example, three different fields have been dragged to different properties in the Marks card. Segment is on Color, Region is on Shape, and Quantity is on Size.
After you add a field to the Marks card, you can click the icon next to the field to change the property it is using. You can also click the property buttons in the Marks card to change those settings.
Many properties can have multiple fields. For example, you can add multiple fields to Label, Detail, Tooltip, and Color. Size and Shape can only have one field at a time. For more details, see Control the Appearance of Marks in the View.
質問 19
メジャーを離散化することは可能ですか?
- A. はい
- B. いいえ
正解: A
解説:
Explanation
Of course! Follow along:
Right click on any measure, and choose Discrete as shown:
Once you do this, the green pill becomes blue in colour, indicating that it is now Discrete!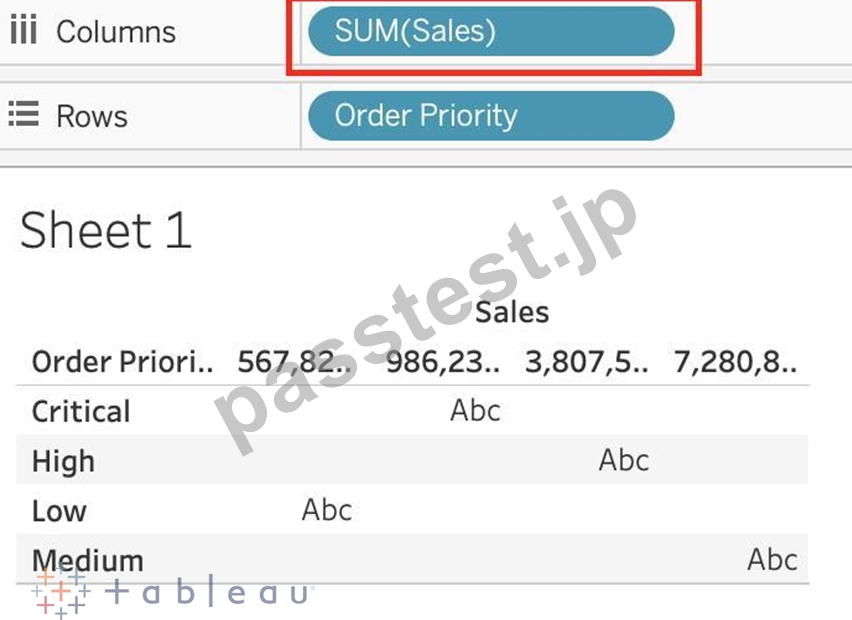
質問 20
Tableauのストーリーポイントは何ですか?
- A. ワークシートとダッシュボードの両方のコレクション
- B. ダッシュボードのコレクション
- C. 単一のワークシートまたはダッシュボード
- D. ワークシートのコレクション
正解: C
解説:
Explanation
In Tableau, a story is a sequence of visualizations that work together to convey information. You can create stories to tell a data narrative, provide context, demonstrate how decisions relate to outcomes, or to simply make a compelling case.
A story is a sheet, so the methods you use to create, name, and manage worksheets and dashboards also apply to stories (for more details, see Workbooks and Sheets). At the same time, a story is also a collection of sheets, arranged in a sequence. Each individual sheet (worksheet or dashboard) in a story is called a story point.
When you share a story -for example, by publishing a workbook to Tableau Public, Tableau Server, or Tableau Online-users can interact with the story to reveal new findings or ask new questions of the data.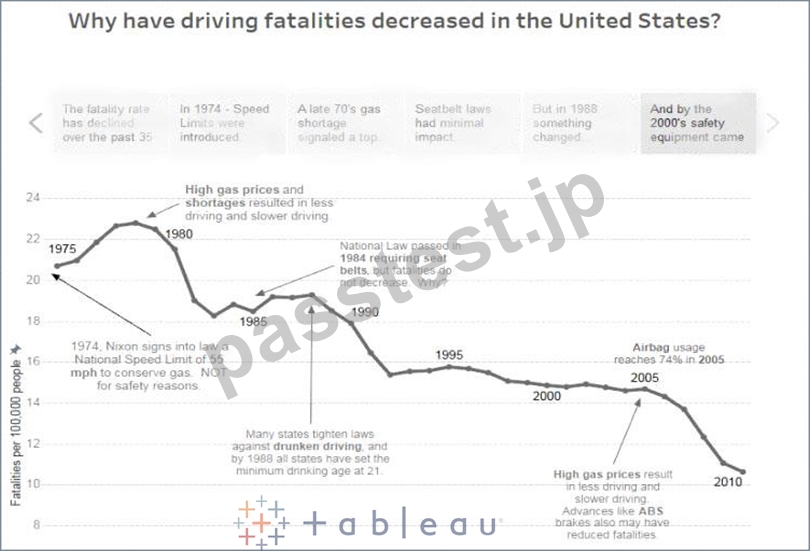
質問 21
次のグラフタイプのどれが「ビニングされた」データを利用しますか?
- A. ヒストグラム
- B. ツリーマップ
- C. ガントチャート
- D. 箇条書き
正解: A
解説:
Explanation
A histogram is a chart that displays the shape of a distribution. A histogram looks like a bar chart but groups values for a continuous measure into ranges, or bins.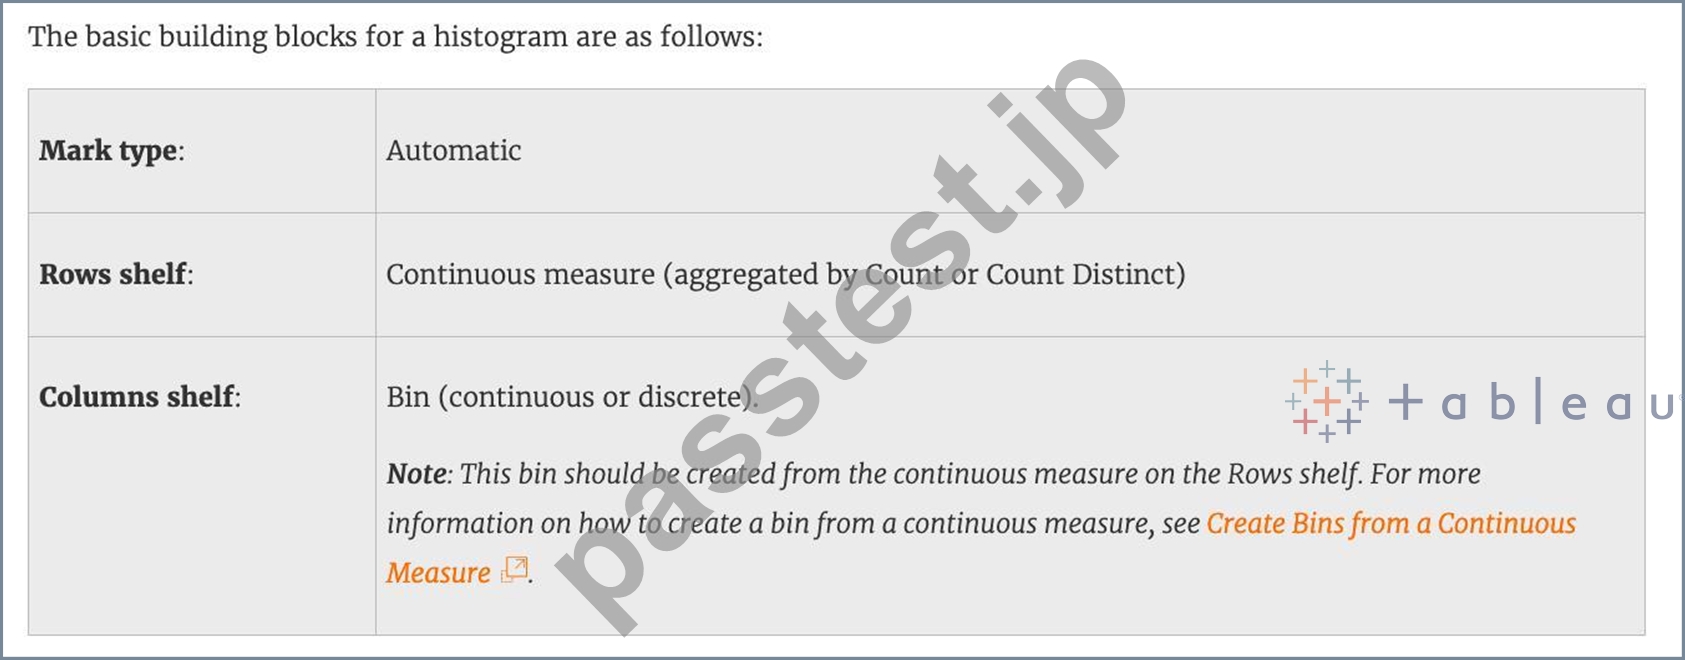
質問 22
Tableau Serverの実稼働での使用に推奨されるRAMの最小量はどれくらいですか?
- A. 8GB
- B. 16GB
- C. 32GB
- D. 64GB
正解: C
解説:
Explanation
The computer on which you are installing or upgrading Tableau Server must meet the minimum hardware requirements. If the Setup program determines that your computer does not meet the following requirements, you will not be able to install Tableau Server.
These minimum requirements are appropriate for a computer that you use for prototyping and testing of Tableau Server. They apply to single-node installations and to each computer in a distributed installation.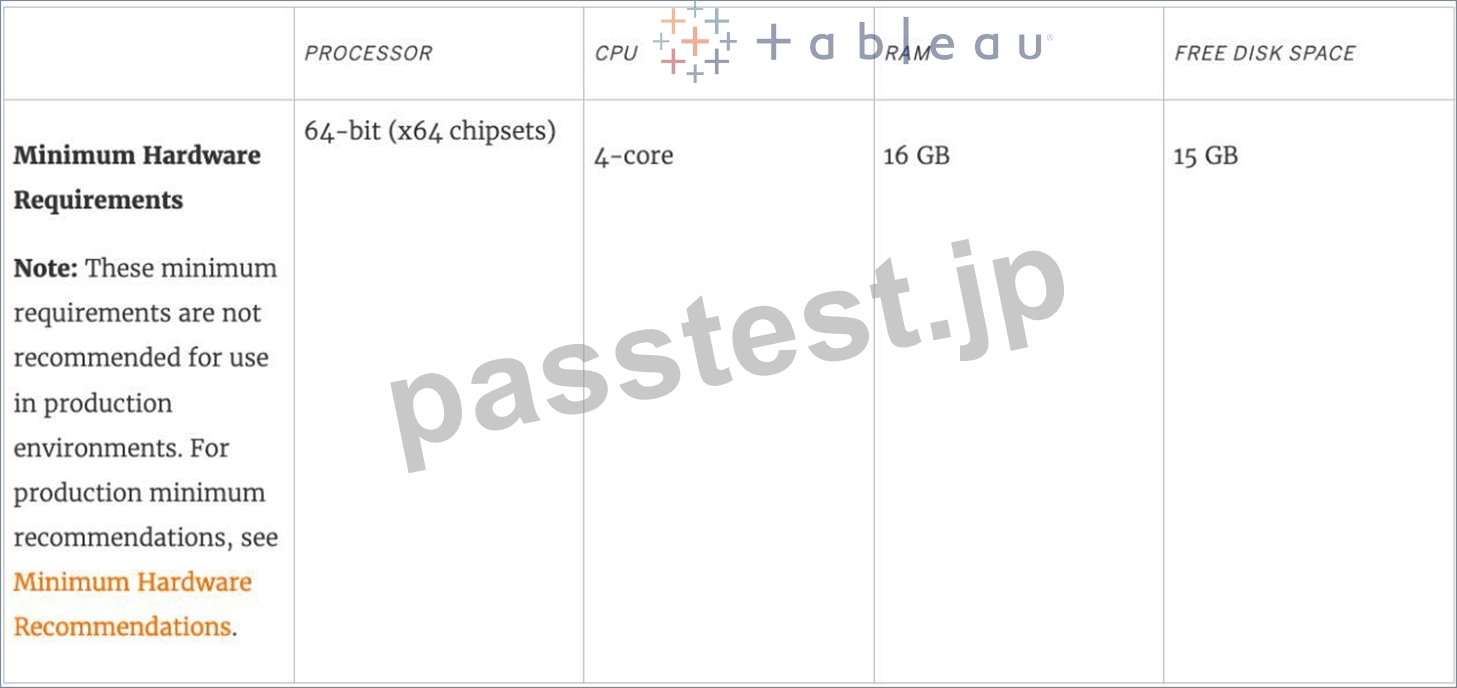
質問 23
このアイコンはTableauのどのデータ型を表していますか?
大きい画像
- A. 正誤問題
- B. 地理的
- C. 文字列
- D. ブール値
正解: B
解説:
Explanation
The following is the table for the data types in Tableau along with their icons: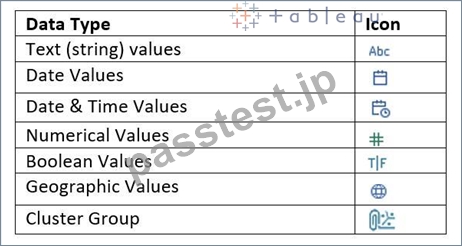
質問 24
質問45:スキップ
ヒストグラムを作成したばかりで、ビンのサイズを動的に変更できるようにしたいと考えています。次のうちどれを使用すると、要件を簡単に満たすことができますか?
- A. パラメータ
- B. セット
- C. 計算
- D. グループ
正解: A
解説:
Explanation
A parameter is a global placeholder value such as a number, date, or string that can replace a constant value in a calculation, filter, or reference line.
For example, you may create a calculated field that returns True if Sales is greater than $500,000 and otherwise returns False. You can replace the constant value of "500000" in the formula with a parameter.
Then, using the parameter control, you can dynamically change the threshold in your calculation.
For example -
質問 25
箇条書きを使用する理由は次のうちどれですか。
- A. 特定の期間の傾向を分析する
- B. 売上高の前年比成長を表示
- C. 将来の売上予測
- D. 実際の売上と目標売上の比較
正解: D
解説:
Explanation
A bullet graph is a variation of a bar graph developed to replace dashboard gauges and meters. A bullet graph is useful for comparing the performance of a primary measure to one or more other measures. Below is a single bullet graph showing how actual sales compared to estimated sales.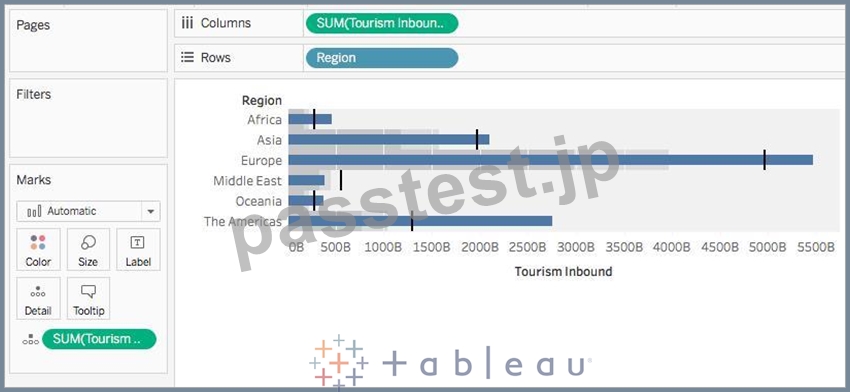
質問 26
正誤問題:データを分解して、ビュー内のすべてのマークを最も詳細なレベルで表示することができる
- A. 偽
- B. 本当
正解: B
解説:
Explanation
Whenever you add a measure to your view, an aggregation is applied to that measure by default. This default is controlled by the Aggregate Measures setting in the Analysis menu.
If you decide you want to see all of the marks in the view at the most detailed level of granularity, you can disaggregate the view. Disaggregating your data means that Tableau will display a separate mark for every data value in every row of your data source.
To disaggregate all measures in the view:
Clear the Analysis >Aggregate Measures option. If it is already selected, click Aggregate Measures once to deselect it.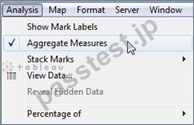
質問 27
大まかに言えば、ユーザーがTableauに接続すると、データセット内のデータフィールドに自動的に割り当てられます。
____________と____________。
- A. 寸法、寸法
- B. データ型、値
- C. タイプ、役割
- D. 役割、タイプ
正解: D
解説:
Explanation
When users connect to Tableau, the data fields in their data set are automatically assigned a role and a type.
Role can be of the following two types:
1) Dimension
2) Measure
Type can be of the following :
1) String
2) Number
3) Geographic
4) Boolean
5) Date
6) Date and Time
質問 28
____________ソートの場合、データがどのように変更されても、値は常に、保持したソート順のままになります。
- A. ランダム
- B. マニュアル
- C. 階層
- D. トポロジカル
正解: B
解説:
Explanation
For a manual sort, no matter how the data changes, the values will always stay in the sort order you kept stuff in.
From the official website: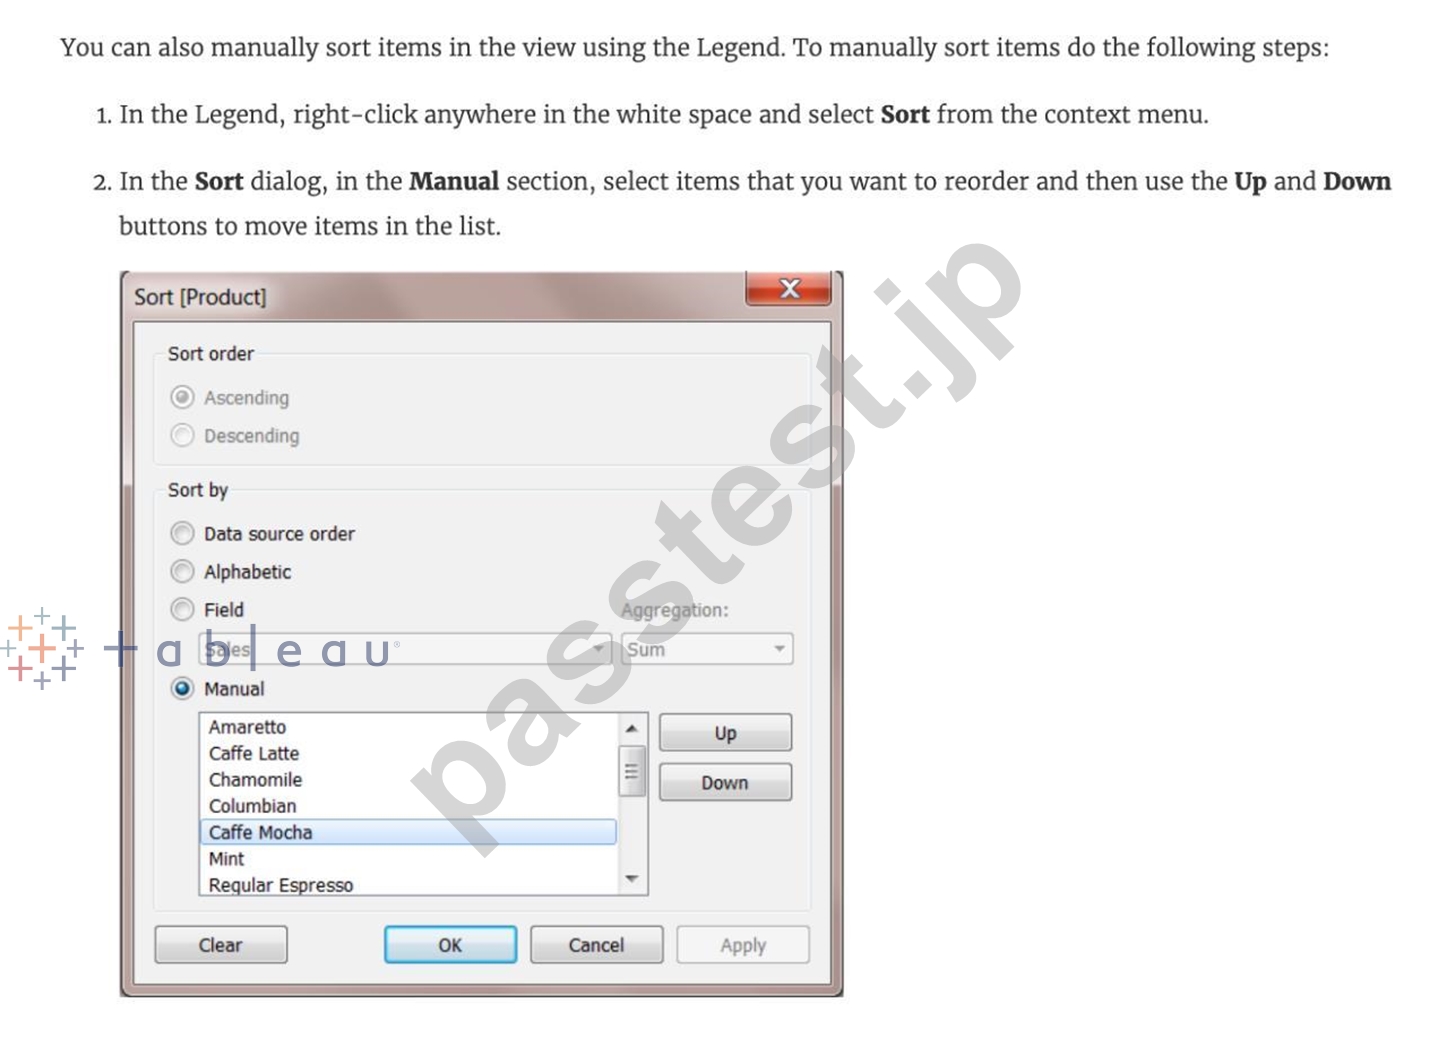
質問 29
__________は、類似した特性を持つマークを識別するTableauの手法です。
- A. ユニオン
- B. クラスタリング
- C. グループ化
- D. セット
正解: B
解説:
Explanation
Cluster analysis partitions marks in the view into clusters, where the marks within each cluster are more similar to one another than they are to marks in other clusters.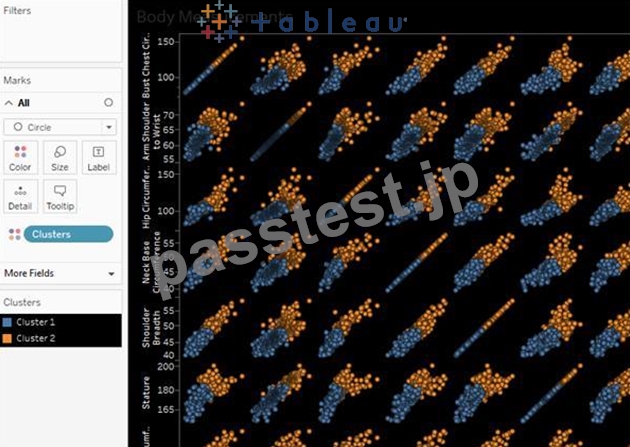
質問 30
Tableauは、値を集計するレベルをどのようにして知るのですか?
- A. 値は常にワークシートの粒度のレベルで集計されます。
- B. 値は常に日付部分のレベルで集計されます
- C. Tableauは値を集計しません、集計します!
- D. 集計は常にTableauの特別な式を使用して行われます
正解: A
解説:
Explanation
In Tableau, you can aggregate measures or dimensions, though it is more common to aggregate measures.
Whenever you add a measure to your view, an aggregation is applied to that measure by default. The type of aggregation applied varies depending on the context of the view.
When you add a measure to the view, Tableau automatically aggregates its values. Sum, average, and median are common aggregations; for a complete list, see List of Predefined Aggregations in Tableau.
The current aggregation appears as part of the measure's name in the view. For example, Sales becomes SUM(Sales). Every measure has a default aggregation which is set by Tableau when you connect to a data source. You can view or change the default aggregation for a measure-see Set the Default Aggregation for a Measure.
You can change the aggregation for a measure in the view from its context menu: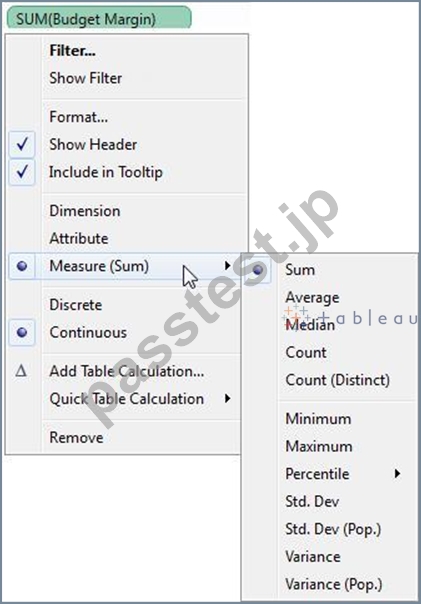
質問 31
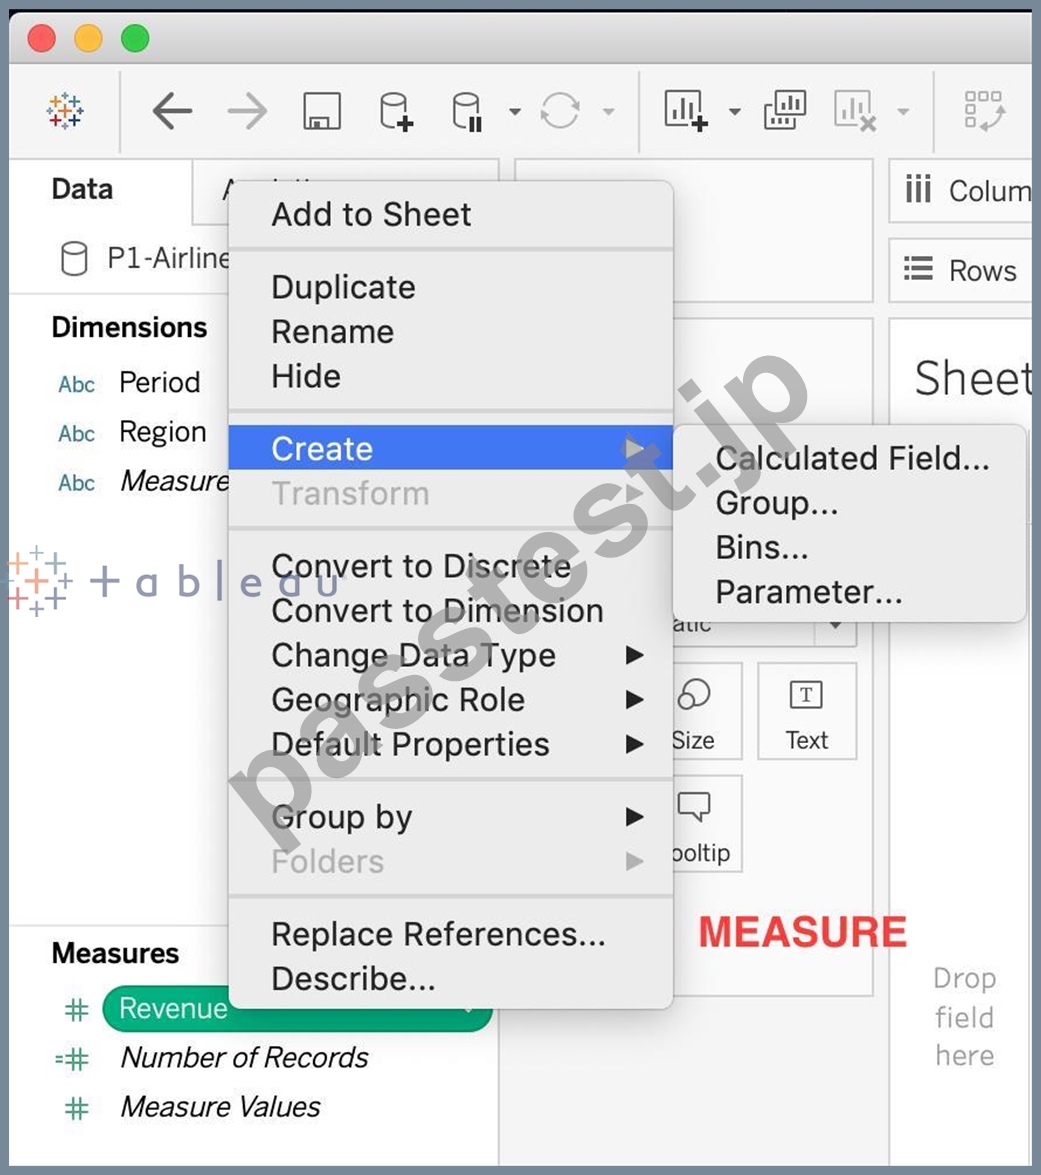
正誤問題:セットはメジャーで作成できる
- A. 偽
- B. 本当
正解: A
解説:
Explanation
Sets are custom fields that are created within Tableau Desktop based on dimensions from your data source.
They are subsets of your data, which can be created manually or computed. Either dimensions or measures can be used to determine what is included or excluded from a set using conditional logic, but to CREATE a set we use dimensions.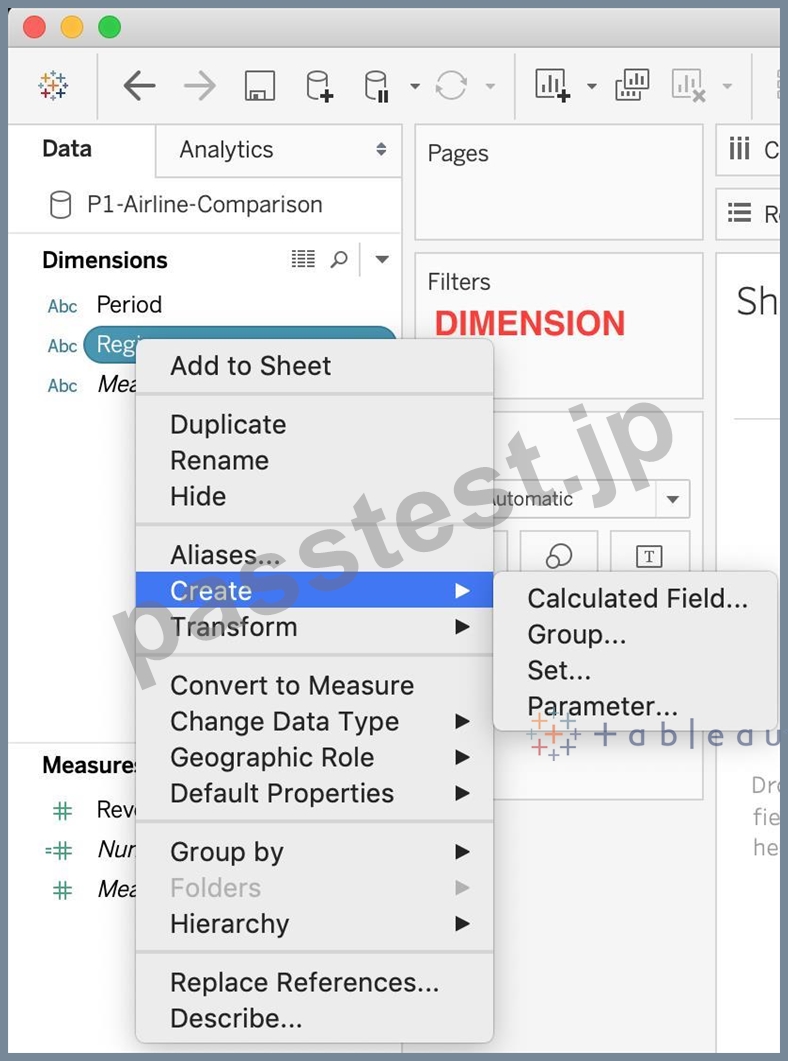
Reference : https://interworks.com/blog/rcurtis/2016/10/26/tableau-deep-dive-sets-introduction-sets/
質問 32
ビジュアライゼーションにカスタムシェイプを追加したいとします。これらの新しい形状をどこに追加できますか?
- A. In My Computer -> C: -> Tableau -> Shapes
- B. In Program Files -> Tableau -> Shapes
- C. In Downloads -> My Tableau Repository -> Shapes
- D. In My Documents -> My Tableau Repository -> Shapes
正解: D
解説:
Explanation
Here's how to add image files to your repository:
1) Find image file on the internet. I try to find consistent image formats if I plan to use a set of shapes such as logos or flags.
2) Download the image to your computer.
3) Drag images into your My Documents -> My Tableau repository -> Shapes folder.
4) Open Tableau and your new shapes will automatically be included in your "edit shapes" menu.
質問 33
......
最新オフィシャル資料はDesktop-Specialist日本語認証されたDesktop-Specialist日本語問題集PDF:https://www.passtest.jp/Tableau/Desktop-Specialist-JPN-shiken.html