

究極のガイド準備問題Databricks-Certified-Data-Analyst-Associateには正確なPDF解答[2025年12月31日]
合格できるDatabricksの試験問題集
Databricks Databricks-Certified-Data-Analyst-Associate 認定試験の出題範囲:
| トピック | 出題範囲 |
|---|---|
| トピック 1 |
|
| トピック 2 |
|
| トピック 3 |
|
| トピック 4 |
|
| トピック 5 |
|
質問 # 36
A data analyst has been asked to configure an alert for a query that returns the income in the accounts_receivable table for a date range. The date range is configurable using a Date query parameter.
The Alert does not work.
Which of the following describes why the Alert does not work?
- A. Queries that return results based on dates cannot be used with Alerts.
- B. The wrong query parameter is being used. Alerts only work with Date and Time query parameters.
- C. Queries that use query parameters cannot be used with Alerts.
- D. The wrong query parameter is being used. Alerts only work with drogdown list query parameters, not dates.
- E. Alerts don't work with queries that access tables.
正解:C
解説:
The reason the alert is not functioning as expected is because Databricks SQL Alerts do not support query parameters. This limitation applies to all types of parameters, including date parameters.
Here's why:
Alerts require static, deterministic query results so they can compare values consistently during scheduled executions.
When a query includes parameters (e.g., a date range parameter), its results may change based on user input or the default value set in the query editor.
However, Databricks SQL Alerts will always use the default value set for the parameter at the time the alert is created. This means the alert doesn't dynamically adapt to new date ranges and will not reflect changes unless the query is manually updated.
As a result, if the business logic behind the alert depends on changing date ranges or any user input, the alert will not trigger correctly, or may never trigger at all.
Therefore, the correct explanation contradicts Option B, which is incorrect in saying that alerts cannot work with date-based queries at all. In fact, they can-as long as the query is static (i.e., without parameters).
Reference:
Databricks SQL Alerts Documentation
Databricks Knowledge: "You cannot use alerts with queries that contain parameters."
質問 # 37
Which statement describes descriptive statistics?
- A. A branch of statistics that uses a variety of data analysis techniques to infer properties of an underlying distribution of probability.
- B. A branch of statistics that uses quantitative variables that must take on a finite or countably infinite set of values.
- C. A branch of statistics that uses summary statistics to categorically describe and summarize data.
- D. A branch of statistics that uses summary statistics to quantitatively describe and summarize data.
正解:D
質問 # 38
What is a benefit of using Databricks SQL for business intelligence (Bl) analytics projects instead of using third-party Bl tools?
- A. Simultaneous multi-user support
- B. Automated alerting systems
- C. Advanced dashboarding capabilities
- D. Computations, data, and analytical tools on the same platform
正解:D
解説:
Databricks SQL offers a unified platform where computations, data storage, and analytical tools coexist seamlessly. This integration allows business intelligence (BI) analytics projects to be executed more efficiently, as users can perform data processing and analysis without the need to transfer data between disparate systems. By consolidating these components, Databricks SQL streamlines workflows, reduces latency, and enhances data governance. While third-party BI tools may offer advanced dashboarding capabilities, simultaneous multi-user support, and automated alerting systems, they often require integration with separate data processing platforms, which can introduce complexity and potential inefficiencies.
質問 # 39
A data engineer is working with a nested array column products in table transactions. They want to expand the table so each unique item in products for each row has its own row where the transaction_id column is duplicated as necessary.
They are using the following incomplete command: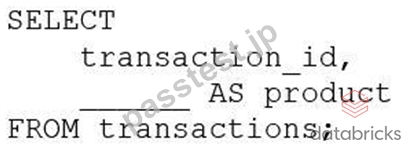
Which of the following lines of code can they use to fill in the blank in the above code block so that it successfully completes the task?
- A. array(produces)
- B. array distinct(produces)
- C. flatten(produces)
- D. reduce(produces)
- E. explode(produces)
正解:E
解説:
The explode function is used to transform a DataFrame column of arrays or maps into multiple rows, duplicating the other column's values. In this context, it will be used to expand the nested array column products in the transactions table so that each unique item in products for each row has its own row and the transaction_id column is duplicated as necessary. Reference: Databricks Documentation I also noticed that you sent me an image along with your message. The image shows a snippet of SQL code that is incomplete. It begins with "SELECT" indicating a query to retrieve data. "transaction_id," suggests that transaction_id is one of the columns being selected. There are blanks indicated by underscores where certain parts of the SQL command should be, including what appears to be an alias for a column and part of the FROM clause. The query ends with "FROM transactions;" indicating data is being selected from a 'transactions' table.
If you are interested in learning more about Databricks Data Analyst Associate certification, you can check out the following resources:
Databricks Certified Data Analyst Associate: This is the official page for the certification exam, where you can find the exam guide, registration details, and preparation tips.
Data Analysis With Databricks SQL: This is a self-paced course that covers the topics and skills required for the certification exam. You can access it for free on Databricks Academy.
Tips for the Databricks Certified Data Analyst Associate Certification: This is a blog post that provides some useful advice and study tips for passing the certification exam.
Databricks Certified Data Analyst Associate Certification: This is another blog post that gives an overview of the certification exam and its benefits.
質問 # 40
Which of the following is a benefit of Databricks SQL using ANSI SQL as its standard SQL dialect?
- A. It is more compatible with Spark's interpreters
- B. It has increased customization capabilities
- C. It allows for the use of Photon's computation optimizations
- D. It is more performant than other SQL dialects
- E. It is easy to migrate existing SQL queries to Databricks SQL
正解:E
解説:
Databricks SQL uses ANSI SQL as its standard SQL dialect, which means it follows the SQL specifications defined by the American National Standards Institute (ANSI). This makes it easier to migrate existing SQL queries from other data warehouses or platforms that also use ANSI SQL or a similar dialect, such as PostgreSQL, Oracle, or Teradata. By using ANSI SQL, Databricks SQL avoids surprises in behavior or unfamiliar syntax that may arise from using a non-standard SQL dialect, such as Spark SQL or Hive SQL12. Moreover, Databricks SQL also adds compatibility features to support common SQL constructs that are widely used in other data warehouses, such as QUALIFY, FILTER, and user-defined functions2. Reference: ANSI compliance in Databricks Runtime, Evolution of the SQL language at Databricks: ANSI standard by default and easier migrations from data warehouses
質問 # 41
A data analyst has a managed table table_name in database database_name. They would now like to remove the table from the database and all of the data files associated with the table. The rest of the tables in the database must continue to exist.
Which of the following commands can the analyst use to complete the task without producing an error?
- A. DROP DATABASE database_name;
- B. DROP TABLE table_name FROM database_name;
- C. DELETE TABLE database_name.table_name;
- D. DROP TABLE database_name.table_name;
- E. DELETE TABLE table_name FROM database_name;
正解:D
質問 # 42
Query History provides Databricks SQL users with a lot of benefits. A data analyst has been asked to share all of these benefits with their team as part of a training exercise. One of the benefit statements the analyst provided to their team is incorrect.
Which statement about Query History is incorrect?
- A. It can be used to automate query execution on multiple warehouses (formerly endpoints).
- B. It can be used to debug queries.
- C. It can be used to troubleshoot slow running queries.
- D. It can be used to view the query plan of queries that have run.
正解:A
解説:
Query History in Databricks SQL is intended for reviewing executed queries, understanding their execution plans, and identifying performance issues or errors for debugging purposes. It allows users to analyze query duration, resources used, and potential bottlenecks. However, Query History does not provide any capability to automate the execution of queries across multiple warehouses; automation must be handled through jobs or external orchestration tools, not through the Query History feature itself.
質問 # 43
Which of the following approaches can be used to connect Databricks to Fivetran for data ingestion?
- A. Use Workflows to establish a cluster for Fivetran to interact with
- B. Use Partner Connect's automated workflow to establish a cluster for Fivetran to interact with
- C. Use Workflows to establish a SQL warehouse (formerly known as a SQL endpoint) for Fivetran to interact with
- D. Use Partner Connect's automated workflow to establish a SQL warehouse (formerly known as a SQL endpoint) for Fivetran to interact with
- E. Use Delta Live Tables to establish a cluster for Fivetran to interact with
正解:B
解説:
Partner Connect is a feature that allows you to easily connect your Databricks workspace to Fivetran and other ingestion partners using an automated workflow. You can select a SQL warehouse or a cluster as the destination for your data replication, and the connection details are sent to Fivetran. You can then choose from over 200 data sources that Fivetran supports and start ingesting data into Delta Lake. Reference: Connect to Fivetran using Partner Connect, Use Databricks with Fivetran
質問 # 44
Which of the following statements describes descriptive statistics?
- A. A branch of statistics that uses quantitative variables that must take on an uncountable set of values.
- B. A branch of statistics that uses a variety of data analysis techniques to infer properties of an underlying distribution of probability.
- C. A branch of statistics that uses quantitative variables that must take on a finite or countably infinite set of values.
- D. A branch of statistics that uses summary statistics to categorically describe and summarize data.
- E. A branch of statistics that uses summary statistics to quantitatively describe and summarize data.
正解:E
解説:
Descriptive statistics is a branch of statistics that uses summary statistics, such as mean, median, mode, standard deviation, range, frequency, or correlation, to quantitatively describe and summarize data. Descriptive statistics can help data analysts understand the main features of a data set, such as its central tendency, variability, or distribution. Descriptive statistics can also help data analysts visualize data using charts, graphs, or tables. Descriptive statistics do not make any inferences or predictions about the data, unlike inferential statistics, which use data analysis techniques to infer properties of an underlying population or probability distribution from a sample of data. Reference: Databricks - Descriptive Statistics, Databricks - Data Analysis with Databricks SQL
質問 # 45
A data analyst needs to use the Databricks Lakehouse Platform to quickly create SQL queries and data visualizations. It is a requirement that the compute resources in the platform can be made serverless, and it is expected that data visualizations can be placed within a dashboard.
Which of the following Databricks Lakehouse Platform services/capabilities meets all of these requirements?
- A. Databricks Machine Learning
- B. Databricks Notebooks
- C. Delta Lake
- D. Databricks SQL
- E. Tableau
正解:D
解説:
Databricks SQL is a serverless data warehouse on the Lakehouse that lets you run all of your SQL and BI applications at scale with your tools of choice, all at a fraction of the cost of traditional cloud data warehouses1. Databricks SQL allows you to create SQL queries and data visualizations using the SQL Analytics UI or the Databricks SQL CLI2. You can also place your data visualizations within a dashboard and share it with other users in your organization3. Databricks SQL is powered by Delta Lake, which provides reliability, performance, and governance for your data lake4. Reference:
Databricks SQL
Query data using SQL Analytics
Visualizations in Databricks notebooks
Delta Lake
質問 # 46
What is used as a compute resource for Databricks SQL?
- A. Single-node clusters
- B. Downstream BI tools integrated with Databricks SQL
- C. Standard clusters
- D. SQL warehouses
正解:D
質問 # 47
A data analyst wants to create a Databricks SQL dashboard with multiple data visualizations and multiple counters. What must be completed before adding the data visualizations and counters to the dashboard?
- A. A markdown-based tile must be added to the top of the dashboard displaying the dashboard's name.
- B. The dashboard owner must also be the owner of the queries, data visualizations, and counters.
- C. All data visualizations and counters must be created using Queries.
- D. A SQL warehouse (formerly known as SQL endpoint) must be turned on and selected.
正解:C
解説:
In Databricks SQL, when creating a dashboard that includes multiple data visualizations and counters, it is imperative that each visualization and counter is based on a query. The process involves the following steps:
Develop Queries:
For each desired visualization or counter, write a SQL query that retrieves the necessary data.
Create Visualizations and Counters:
After executing each query, utilize the results to create corresponding visualizations or counters. Databricks SQL offers a variety of visualization types to represent data effectively.
Assemble the Dashboard:
Add the created visualizations and counters to your dashboard, arranging them as needed to convey the desired insights.
By ensuring that all components of the dashboard are derived from queries, you maintain consistency, accuracy, and the ability to refresh data as needed. This approach also facilitates easier maintenance and updates to the dashboard elements.
質問 # 48
A data analyst has been asked to count the number of customers in each region and has written the following query:
If there is a mistake in the query, which of the following describes the mistake?
- A. The query is using ORDER BY. which is not allowed in an aggregation.
- B. The query is missing a GROUP BY region clause.
- C. The query is selecting region but region should only occur in the ORDER BY clause.
- D. There are no mistakes in the query.
- E. The query is using count('). which will count all the customers in the customers table, no matter the region.
正解:B
解説:
In the provided SQL query, the data analyst is trying to count the number of customers in each region. However, they made a mistake by not including the "GROUP BY" clause to group the results by region. Without this clause, the query will not return counts for each distinct region but rather an error or incorrect result. Reference: The need for a GROUP BY clause in such queries can be understood from Databricks SQL documentation: Databricks SQL.
I also noticed that you uploaded an image with your question. The image shows a snippet of an SQL query written in plain text on a white background. The query is attempting to select regions and count customers from a "customers" table and order the results by region. There's no visible syntax highlighting or any other color - it's monochromatic. The query is the same as the one in your question. I'm not sure why you included the image, but maybe you wanted to show me the exact format of your query. If so, you can also use code blocks to display formatted content such as SQL queries. For example, you can write:
SELECT region, count(*) AS number_of_customers
FROM customers
ORDER BY region;
This way, you can avoid uploading images and make your questions more clear and concise. I hope this helps.
質問 # 49
A data analyst has created a user-defined function using the following line of code:
CREATE FUNCTION price(spend DOUBLE, units DOUBLE)
RETURNS DOUBLE
RETURN spend / units;
Which of the following code blocks can be used to apply this function to the customer_spend and customer_units columns of the table customer_summary to create column customer_price?
- A. SELECT double(price(customer_spend, customer_units)) AS customer_price FROM customer_summary
- B. SELECT PRICE customer_spend, customer_units AS customer_price FROM customer_summary
- C. SELECT price FROM customer_summary
- D. SELECT function(price(customer_spend, customer_units)) AS customer_price FROM customer_summary
- E. SELECT price(customer_spend, customer_units) AS customer_price FROM customer_summary
正解:E
解説:
A user-defined function (UDF) is a function defined by a user, allowing custom logic to be reused in the user environment1. To apply a UDF to a table, the syntax is SELECT udf_name(column_name) AS alias FROM table_name2. Therefore, option E is the correct way to use the UDF price to create a new column customer_price based on the existing columns customer_spend and customer_units from the table customer_summary. Reference:
What are user-defined functions (UDFs)?
User-defined scalar functions - SQL
V
質問 # 50
In which of the following situations should a data analyst use higher-order functions?
- A. When built-in functions are taking too long to perform tasks
- B. When custom logic needs to be converted to Python-native code
- C. When built-in functions need to run through the Catalyst Optimizer
- D. When custom logic needs to be applied at scale to array data objects
- E. When custom logic needs to be applied to simple, unnested data
正解:D
解説:
Higher-order functions are a simple extension to SQL to manipulate nested data such as arrays. A higher-order function takes an array, implements how the array is processed, and what the result of the computation will be. It delegates to a lambda function how to process each item in the array. This allows you to define functions that manipulate arrays in SQL, without having to unpack and repack them, use UDFs, or rely on limited built-in functions. Higher-order functions provide a performance benefit over user defined functions. Reference: Higher-order functions | Databricks on AWS, Working with Nested Data Using Higher Order Functions in SQL on Databricks | Databricks Blog, Higher-order functions - Azure Databricks | Microsoft Learn, Optimization recommendations on Databricks | Databricks on AWS
質問 # 51
A data organization has a team of engineers developing data pipelines following the medallion architecture using Delta Live Tables. While the data analysis team working on a project is using gold-layer tables from these pipelines, they need to perform some additional processing of these tables prior to performing their analysis.
Which of the following terms is used to describe this type of work?
- A. Data enhancement
- B. Last-mile
- C. Data blending
- D. Data testing
- E. Last-mile ETL
正解:E
解説:
Last-mile ETL is the term used to describe the additional processing of data that is done by data analysts or data scientists after the data has been ingested, transformed, and stored in the lakehouse by data engineers. Last-mile ETL typically involves tasks such as data cleansing, data enrichment, data aggregation, data filtering, or data sampling that are specific to the analysis or machine learning use case. Last-mile ETL can be done using Databricks SQL, Databricks notebooks, or Databricks Machine Learning. Reference: Databricks - Last-mile ETL, Databricks - Data Analysis with Databricks SQL
質問 # 52
A data analyst created and is the owner of the managed table my_ table. They now want to change ownership of the table to a single other user using Data Explorer.
Which of the following approaches can the analyst use to complete the task?
- A. Edit the Owner field in the table page by removing their own account
- B. Edit the Owner field in the table page by selecting the Admins group
- C. Edit the Owner field in the table page by selecting All Users
- D. Edit the Owner field in the table page by selecting the new owner's account
- E. Edit the Owner field in the table page by removing all access
正解:D
解説:
The Owner field in the table page shows the current owner of the table and allows the owner to change it to another user or group. To change the ownership of the table, the owner can click on the Owner field and select the new owner from the drop-down list. This will transfer the ownership of the table to the selected user or group and remove the previous owner from the list of table access control entries1. The other options are incorrect because:
A . Removing the owner's account from the Owner field will not change the ownership of the table, but will make the table ownerless2.
B . Selecting All Users from the Owner field will not change the ownership of the table, but will grant all users access to the table3.
D . Selecting the Admins group from the Owner field will not change the ownership of the table, but will grant the Admins group access to the table3.
E . Removing all access from the Owner field will not change the ownership of the table, but will revoke all access to the table4. Reference:
1: Change table ownership
2: Ownerless tables
3: Table access control
4: Revoke access to a table
質問 # 53
Consider the following two statements:
Statement 1:
Statement 2:
Which of the following describes how the result sets will differ for each statement when they are run in Databricks SQL?
- A. When the first statement is run, only rows from the customers table that have at least one match with the orders table on customer_id will be returned. When the second statement is run, only those rows in the customers table that do not have at least one match with the orders table on customer_id will be returned.
- B. Both statements will fail because Databricks SQL does not support those join types.
- C. When the first statement is run, all rows from the customers table will be returned and only the customer_id from the orders table will be returned. When the second statement is run, only those rows in the customers table that do not have at least one match with the orders table on customer_id will be returned.
- D. The first statement will return all data from the customers table and matching data from the orders table. The second statement will return all data from the orders table and matching data from the customers table. Any missing data will be filled in with NULL.
- E. There is no difference between the result sets for both statements.
正解:A
解説:
Based on the images you sent, the two statements are SQL queries for different types of joins between the customers and orders tables. A join is a way of combining the rows from two table references based on some criteria. The join type determines how the rows are matched and what kind of result set is returned. The first statement is a query for a LEFT SEMI JOIN, which returns only the rows from the left table reference (customers) that have a match with the right table reference (orders) on the join condition (customer_id). The second statement is a query for a LEFT ANTI JOIN, which returns only the rows from the left table reference (customers) that have no match with the right table reference (orders) on the join condition (customer_id). Therefore, the result sets for the two statements will differ in the following way:
The first statement will return a subset of the customers table that contains only the customers who have placed at least one order. The number of rows returned will be less than or equal to the number of rows in the customers table, depending on how many customers have orders. The number of columns returned will be the same as the number of columns in the customers table, as the LEFT SEMI JOIN does not include any columns from the orders table.
The second statement will return a subset of the customers table that contains only the customers who have not placed any order. The number of rows returned will be less than or equal to the number of rows in the customers table, depending on how many customers have no orders. The number of columns returned will be the same as the number of columns in the customers table, as the LEFT ANTI JOIN does not include any columns from the orders table.
The other options are not correct because:
A) The first statement will not return all data from the customers table, as it will exclude the customers who have no orders. The second statement will not return all data from the orders table, as it will exclude the orders that have a matching customer. Neither statement will fill in any missing data with NULL, as they do not return any columns from the other table.
C) There is a difference between the result sets for both statements, as explained above. The LEFT SEMI JOIN and the LEFT ANTI JOIN are not equivalent operations and will produce different outputs.
D) Both statements will not fail, as Databricks SQL does support those join types. Databricks SQL supports various join types, including INNER, LEFT OUTER, RIGHT OUTER, FULL OUTER, LEFT SEMI, LEFT ANTI, and CROSS. You can also use NATURAL, USING, or LATERAL keywords to specify different join criteria.
E) The first statement will not return only the customer_id from the orders table, as it will return all columns from the customers table. The second statement is correct, but it is not the only difference between the result sets.
質問 # 54
A business analyst has been asked to create a data entity/object called sales_by_employee. It should always stay up-to-date when new data are added to the sales table. The new entity should have the columns sales_person, which will be the name of the employee from the employees table, and sales, which will be all sales for that particular sales person. Both the sales table and the employees table have an employee_id column that is used to identify the sales person.
Which of the following code blocks will accomplish this task?
- A.
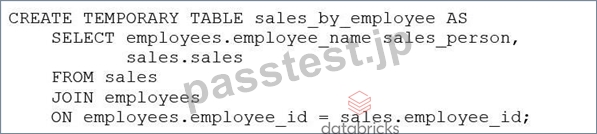
- B.

- C.
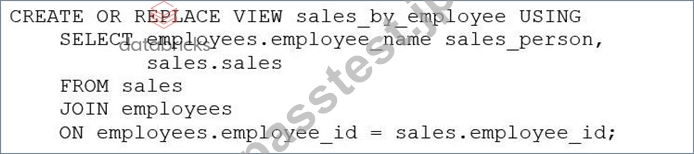
- D.
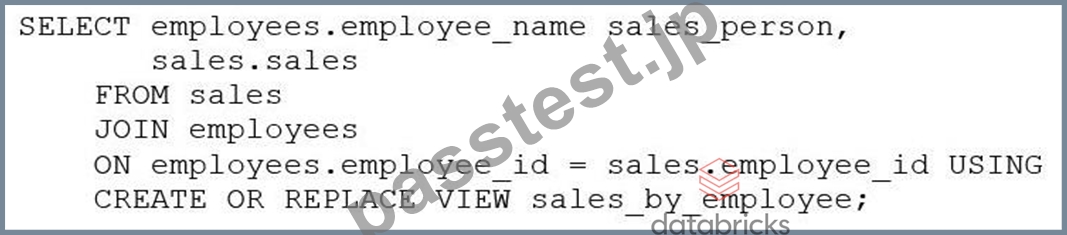
正解:B
解説:
The SQL code provided in Option D is the correct way to create a view named sales_by_employee that will always stay up-to-date with the sales and employees tables. The code uses the CREATE OR REPLACE VIEW statement to define a new view that joins the sales and employees tables on the employee_id column. It selects the employee_name as sales_person and all sales for each employee, ensuring that the data entity/object is always up-to-date when new data are added to these tables.
質問 # 55
A data analyst creates a Databricks SQL Query where the result set has the following schema:
region STRING
number_of_customer INT
When the analyst clicks on the "Add visualization" button on the SQL Editor page, which of the following types of visualizations will be selected by default?
- A. Violin Chart
- B. Line Chart
- C. IBar Chart
- D. There is no default. The user must choose a visualization type.
- E. Histogram
正解:C
解説:
According to the Databricks SQL documentation, when a data analyst clicks on the "Add visualization" button on the SQL Editor page, the default visualization type is Bar Chart. This is because the result set has two columns: one of type STRING and one of type INT. The Bar Chart visualization automatically assigns the STRING column to the X-axis and the INT column to the Y-axis. The Bar Chart visualization is suitable for showing the distribution of a numeric variable across different categories. Reference: Visualization in Databricks SQL, Visualization types
質問 # 56
......
最新Databricks-Certified-Data-Analyst-Associate試験問題集で有効で最新の問題集:https://www.passtest.jp/Databricks/Databricks-Certified-Data-Analyst-Associate-shiken.html
完全版で最新のDatabricks-Certified-Data-Analyst-Associate問題集で100%カバー率問題と解答があなたをリアル試験で合格させる:https://drive.google.com/open?id=1GeyJ5KcOCged-nN_jls5qnDhXqiyCqms