

TDA-C01日本語実際の問題解答PDFには100%カバー率リアル試験問題
TDA-C01日本語試験問題解答
質問 # 40
デスクトップにある Book1 へのリンクを開きます。線ワークシートを開きます。
各領域の両方のメジャーの主値と最大値のみを表示するようにグラフを変更します。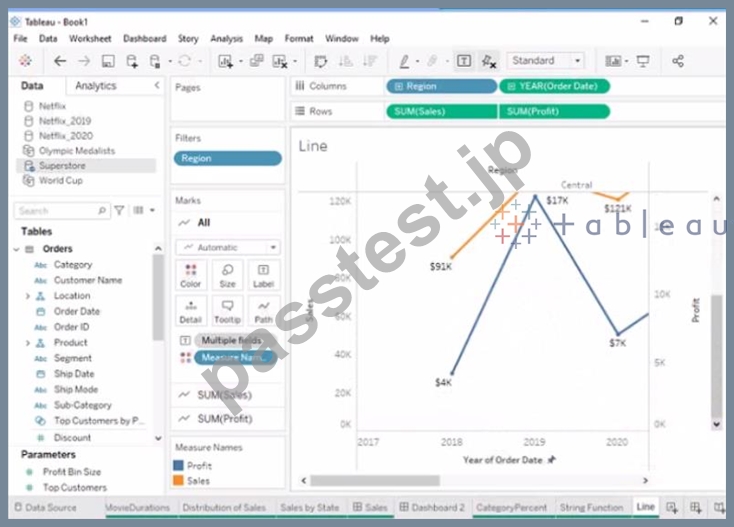
正解:
解説:
check the steps below in explanation
Explanation:
To modify the chart to show only min and max values of both measures in each region, you need to do the following steps:
Open the link to Book1 found on the desktop. This will open the Tableau workbook that contains the Line worksheet.
Click on the Line tab at the bottom of the workbook to open the worksheet. You will see a line chart that shows the sales and profit for each month by region.
Drag Month from the Columns shelf to Filters shelf. This will open a dialog box that allows you to filter by different criteria.
Select Range of Dates from the dialog box. This will show you options to filter by a range of dates or values.
Select Minimum and Maximum from the drop-down list next to Month. This will filter by the minimum and maximum values of Month for each region. You can also enter specific values or use the sliders to adjust the range.
Click OK to apply the filter. You will see that the line chart now shows only min and max values of both measures in each region.
質問 # 41
米国のすべての都市のデータを含むデータ ソースがあります。以下はデータのサンプルです。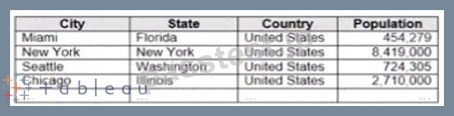
City ディメンションを使用して、人口が 100 万人を超える都市に雪を降らせる動的フィルターを作成する必要があります。どのタイプのフィルターを使用する必要がありますか?
- A. 一般フィルター
- B. 条件フィルター
- C. ワイルドカード フィルター
- D. トップフィルター
正解:D
質問 # 42
簡単な表計算を使用して、Sales という名前のメジャーの移動平均を計算します。
過去 3 年間の移動平均を計算する必要があります。
[表計算] ダイアログ ボックスでどの設定を変更する必要がありますか? {回答エリアで適切なオプションをクリックします)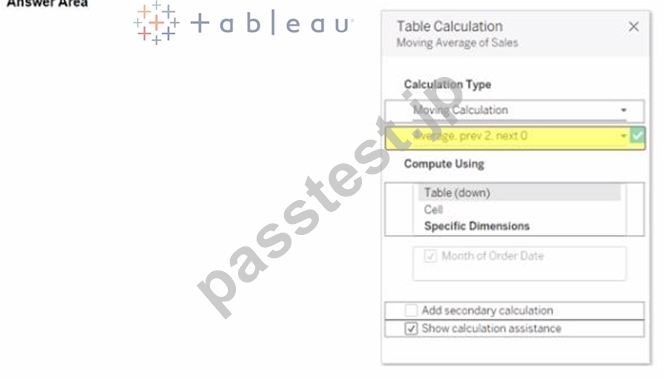
正解:
解説: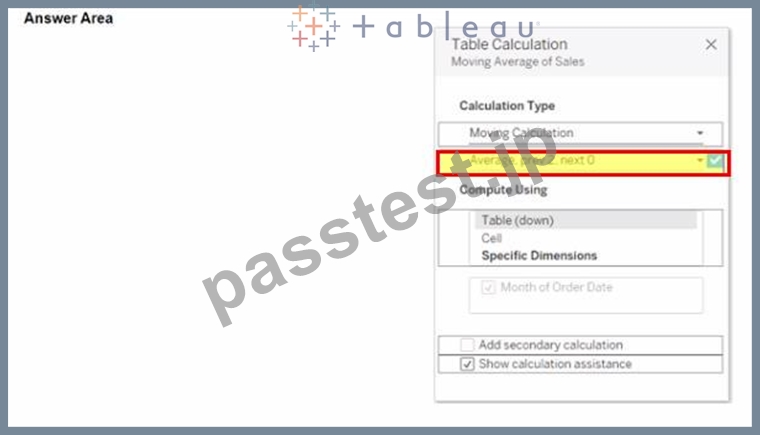
質問 # 43
次のデータセットがあります。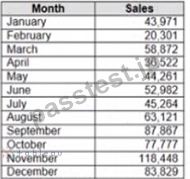
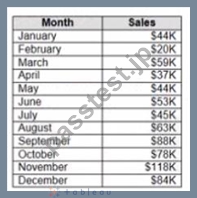
ワークシートでデータセットを使用する場合、次の表に示すように、Sales が自動的に表示されるようにします。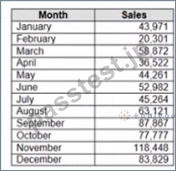
あなたは何をするべきか?
- A. 売上高の既定の数値形式を変更する
- B. 'S' * str (Round((sales],2)) + 'k' の数式を使用する計算フィールドを作成します。
- C. Sates フィールドのデータ型を Siring に変更します。
- D. 'S' + stri < (Sales)/1000)) の数式を使用する計算フィールドを作成します。
正解:A
解説:
To make Sales appear automatically as shown in the second table, you should change the default number format of the Sales field. The default number format is how Tableau displays a field when you drag it to a worksheet. You can change the default number format by right-clicking on the field and selecting Default Properties > Number Format from the menu. This will open a dialog box where you can choose a category, such as Currency or Percentage, and customize the options, such as decimal places or prefixes.
In this case, you want to change the default number format of Sales to Currency with zero decimal places and a custom prefix of "S". This will make Sales appear as "S" followed by the rounded value in thousands.
The other options are not correct for this scenario. Changing the data type of Sales to String will not affect how it appears on a worksheet. Creating a calculated field that uses a formula will not change the default number format of Sales, but create a new field that you have to drag to a worksheet. Converting Sales to Attribute will return only one value for each partition of data, which will not show any variation over time. Reference: https://help.tableau.com/current/pro/desktop/en-us/formatting.htm https://help.tableau.com/current/pro/desktop/en-us/formatting_change_default.htm
質問 # 44
デスクトップにある Book1 へのリンクを開きます。スーパーストア データ ソースを使用します。
「顧客名」フィールドを「名」と「姓」という名前の 2 つのフィールドに分割します。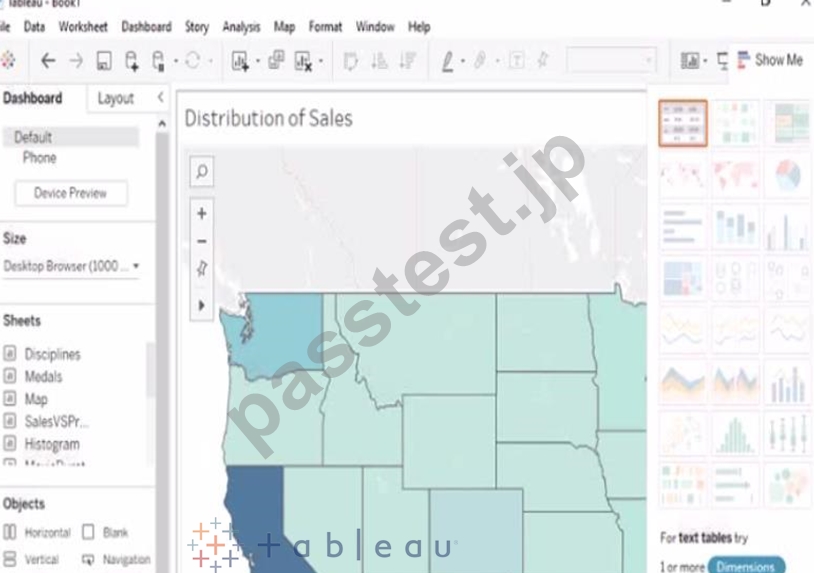
正解:
解説:
check the steps below in explanation.
Explanation:
To split the Customer Name field into two fields named First Name and Last Name, you need to do the following steps:
Open the link to Book1 found on the desktop. This will open the Tableau workbook that uses the Superstore data source.
Go to the Data Source tab at the bottom of the workbook to see the data source page. You will see a table that shows the fields and values from the Superstore data source.
Right-click on Customer Name in the table and select Split from the menu. This will split the field into two fields based on a separator, which is a space by default. You will see two new fields named Customer Name - Split 1 and Customer Name - Split 2 in the table.
Right-click on Customer Name - Split 1 and select Rename from the menu. Type First Name as the new name and press Enter. This will rename the field as First Name.
Right-click on Customer Name - Split 2 and select Rename from the menu. Type Last Name as the new name and press Enter. This will rename the field as Last Name.
References: https://help.tableau.com/current/pro/desktop/en-us/datasource_prepare.htm
https://help.tableau.com/current/pro/desktop/en-us/split.htm
https://help.tableau.com/current/pro/desktop/en-us/renamefield.htm
質問 # 45
デスクトップにある Book1 へのリンクを開きます。SalesVSProfit ワークシートを開きます。
Profit に分布バンドを追加して、-1 から 1 までの標準偏差を示します。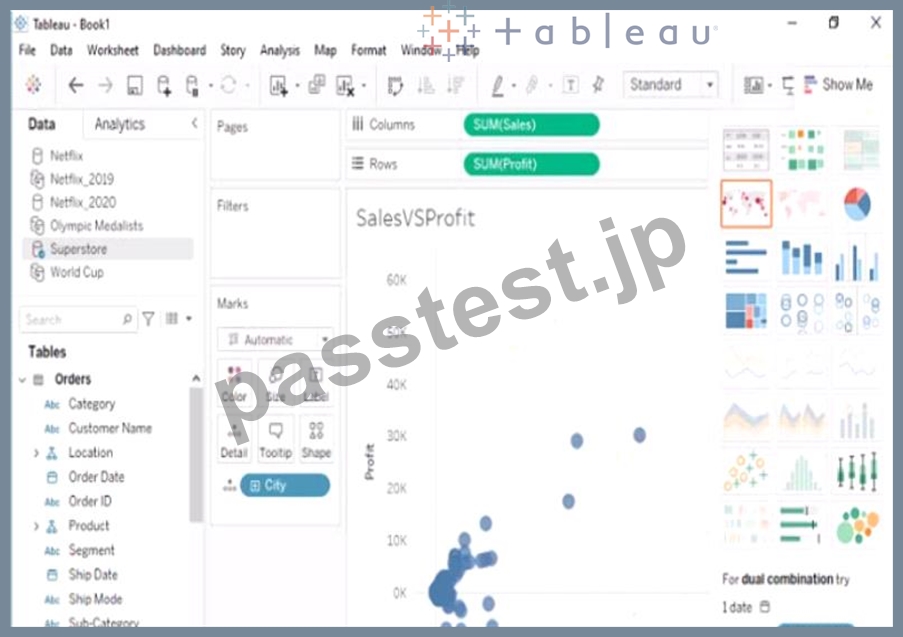
- A. をお送りください
- B. フィードバックをお送りください。
正解:B
質問 # 46
Tableau ワークブックを Microsoft Excel スプレッドシートのデータセットに接続したいと考えています。
Tableau Desktop から何をすべきですか?
- A. [データ] メニューから [データ ソースの置換] を選択します。
- B. [データ] メニューから [新しいデータ ソース] を選択します。
- C. [ファイル] メニューから [新規] を選択します。
- D. [ファイル] メニューから [ワークブックのインポート] を選択します。
正解:C
質問 # 47
次のデータセットがあります。
「日」フィールドに結果を生成する必要があります。
式をどのように完成させるべきでしょうか? (回答領域のドロップダウンを使用して正しいオプションを選択し、数式を完成させてください。)
正解:
解説:
質問 # 48
次のワークシートを作成します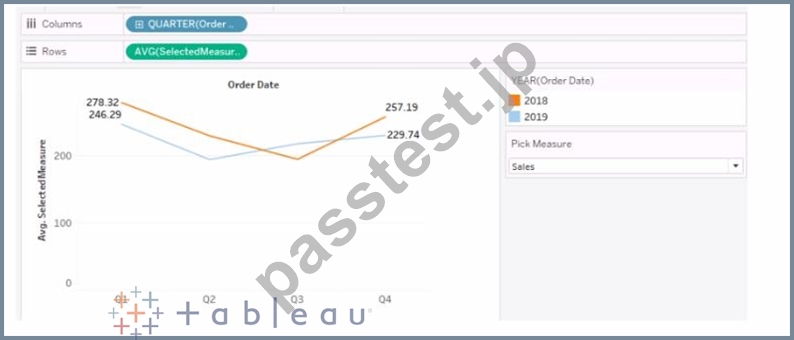
Pick Measure パラメータには、次の値のリストが含まれます。
ユーザーは、「メジャーの選択」から値を選択して、売上メジャーまたは利益メジャーのいずれかを表示するようにビジュアライゼーションを変更できます。
メジャーを切り替えるには、[選択されたメジャー] 計算フィールドでどの式が使用されますか?
- A. ケース[ピックメジャー]
WHEN 1 then ([売上])
WHEN 2 then ([利益]) END - B. ケース AVG([メジャーの選択])
WHEN [売上] の場合 1
WHEN [利益] then 2
終わり - C. ケース STFMEPick メジャー])
WHEN "売上" then ([売上])
WHEN "利益" then ([利益]) e::i - D. ケース [ピックメジャー:
WHEN [売上] の場合 1
WHEN [利益] then 2 END
正解:A
解説:
https://help.tableau.com/current/pro/desktop/en-us/parameters_swap.htm
質問 # 49
時間の経過に伴う利益と割引を示す次のグラフがあります。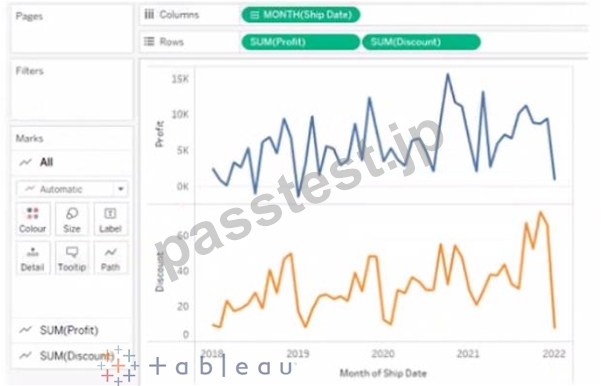
次の図に示すように表示するには、線を組み合わせる必要があります。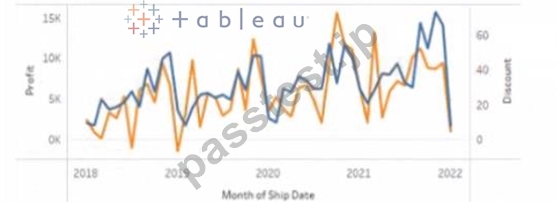
あなたは何をするべきか?
- A. 割引をマーク カードの [色] にドラッグします。
- B. ディスカウントを 2 軸に設定
- C. [割引] を [列] シェルフにドラッグします。
- D. ディスカウントをディスクリートに変換
正解:B
解説:
To combine the lines to appear as shown in the second chart, you should set Discount to Dual Axis. Dual Axis is a feature that allows you to show two measures on two separate axes on one chart. You can create a dual axis by right-clicking on a measure on any shelf and selecting Dual Axis from the menu. This will create two axes on one chart and synchronize their scales.
In this case, you want to show Profit and Discount on two separate axes on one chart. You can right-click on Discount on any shelf and select Dual Axis from the menu. This will create a dual axis chart that shows Profit and Discount as two lines with different colors.
The other options are not correct for this scenario. Dragging Discount to Color on the Marks card will change the color of Profit based on Discount, but it will not show two lines. Converting Discount to Discrete will change Discount from a green pill to a blue pill, but it will not affect how it appears on the chart. Dragging Discount to Columns shelf will create two separate charts for Profit and Discount, but it will not combine them. Reference: https://help.tableau.com/current/pro/desktop/en-us/multiplemeasures.htm https://help.tableau.com/current/pro/desktop/en-us/multiplemeasures_dualaxes.htm
質問 # 50
ワークブックを Tableau Server にパブリッシュする予定です。
ユーザーが現在のダッシュボードから他の公開ダッシュボードを表示できるようにしたいと考えています。
どの設定を構成する必要がありますか? (回答エリアで適切なオプションをクリックします。)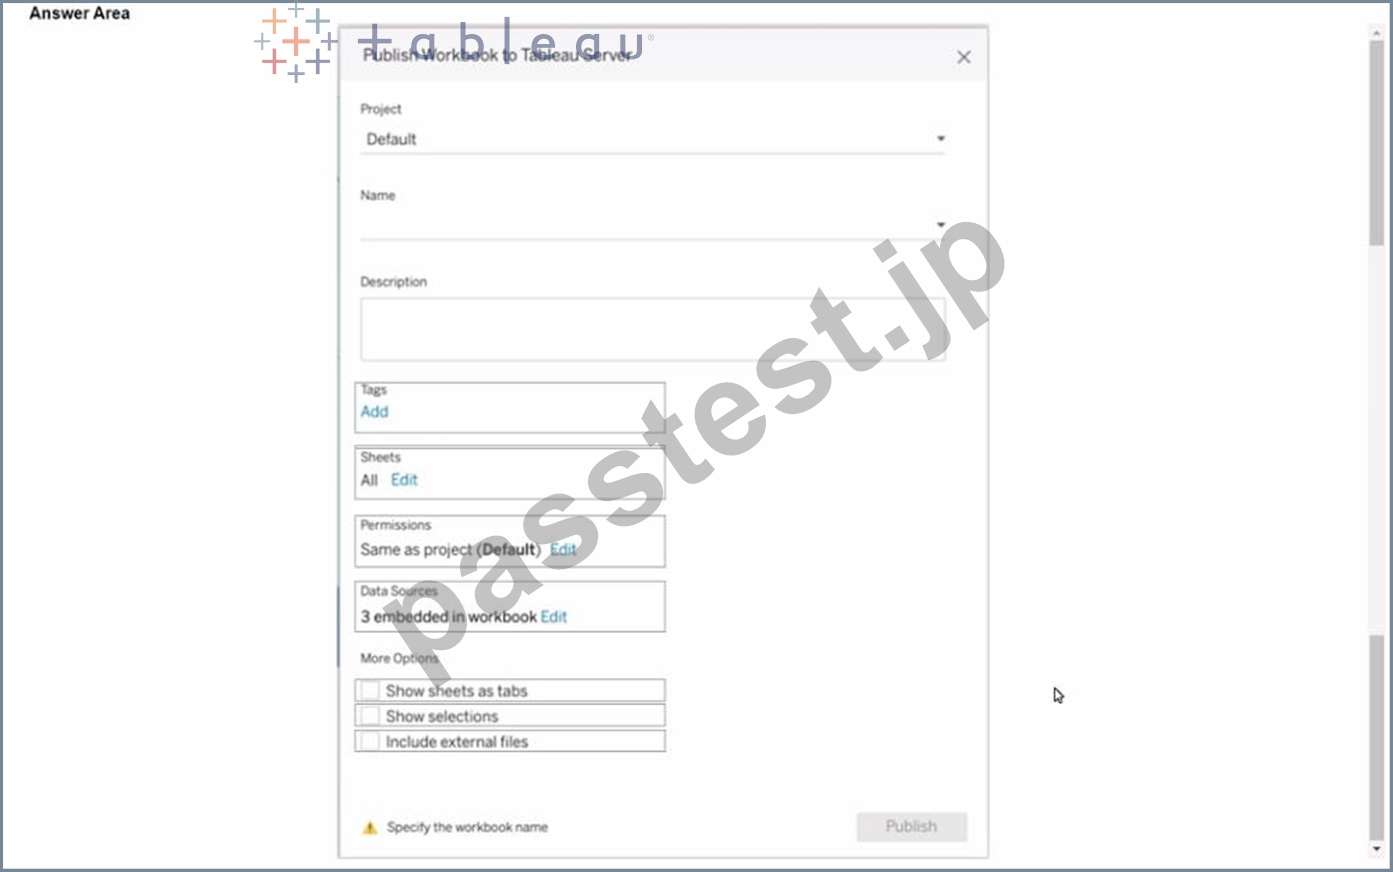
正解:
解説: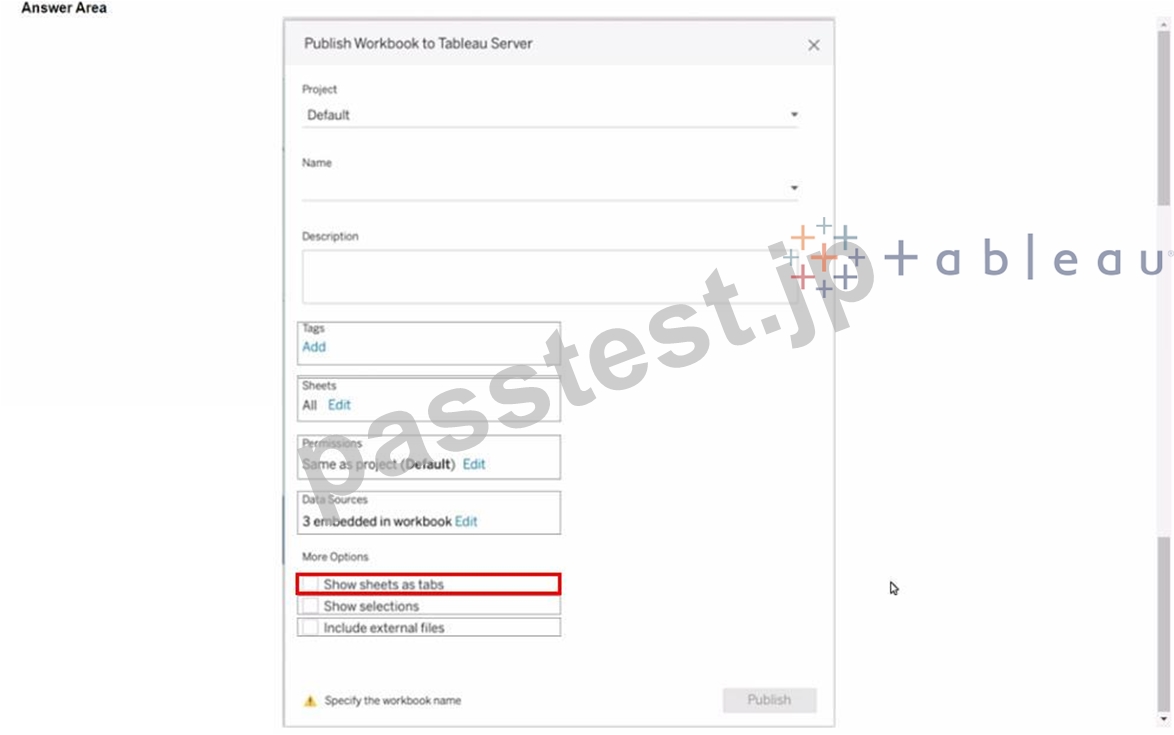
質問 # 51
次のデータセットがあります。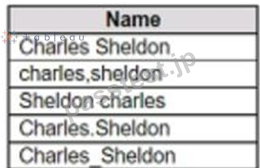
5 つの名前すべてを自動的にグループ化するには、Tableau Prep でどのグループ化オプションを使用する必要がありますか?
- A. スペル
- B. 手動選択
- C. 一般的な文字
- D. 発音
正解:C
解説:
Common Characters: Find and group values that have letters or numbers in common. This option uses the ngram fingerprint algorithm that indexes words by their unique characters after removing punctuation, duplicates, and whitespace. This algorithm works for any supported language. This option isn't available for data roles. For example, this algorithm would match names that are represented as "John Smith" and "Smith, John" because they both generate the key "hijmnost". Since this algorithm doesn't consider pronunciation, the value "Tom Jhinois" would have the same key "hijmnost" and would also be included in the group.
質問 # 52
sales、City、および Region という名前のフィールドを含むデータベースがあります。
さまざまな都市での販売数を示す次のグラフがあります。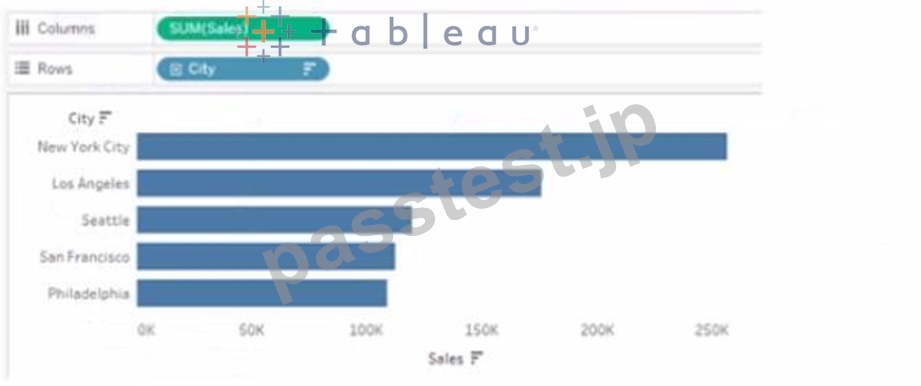
ユーザーがいずれかの棒の上にマウスを置いたときに、対応する領域を動的に表示したいとします。
あなたは何をするべきか?
- A. チャットで a を右クリックし、[注釈] を選択してから [マーク] を選択します。
- B. グラフのバーを右クリックし、[ラベルをマーク] を選択してから、[常に表示] を選択します。
- C. [領域] を [マーク] カードのツールヒントにドラッグします。
- D. City のエイリアスを編集します。
正解:C
解説:
To show the corresponding region when users hover their mouse over any of the bars, you need to drag Region to Tooltip on the Marks card. This will add Region as a field in the tooltip text that appears when users hover over a mark. You can also customize the tooltip text by editing it in the Tooltip dialog box. References:
https://help.tableau.com/current/pro/desktop/en-us/buildmanual_shelves.htm
https://help.tableau.com/current/pro/desktop/en-us/formatting_tooltips.htm To show additional information such as the corresponding region when hovering over a bar in Tableau, you can drag the 'Region' field to the 'Tooltip' shelf on the 'Marks' card. This will ensure that when a user hovers over a bar representing a city, the tooltip will dynamically display the region associated with that city.
質問 # 53
Sheet 1 と Sheet 2 という 2 つのシートを含むダッシュボードがあります。
ユーザーがクリックしてワークブック内の別のダッシュボードに切り替えることができるオブジェクトをダッシュボードに追加したいと考えています。
どのオブジェクトをダッシュボードに追加する必要がありますか?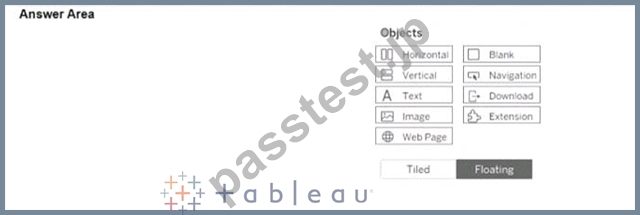
正解:
解説: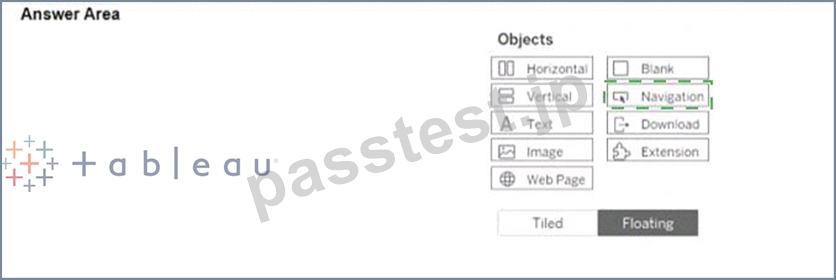
Explanation:
The object that you should add to the dashboard to allow users to switch to a different dashboard in the workbook is Navigation.
Navigation objects are used to create links between dashboards or sheets in a workbook. You can add a navigation object to a dashboard by dragging it from the list of objects and dropping it on the dashboard. You can then configure the navigation object to specify the destination dashboard or sheet that you want users to navigate to when they click on it.
You can learn more about navigation objects and how to use them in this article:
https://help.tableau.com/current/pro/desktop/en-us/dashboards_navigation.htm
質問 # 54
次のダッシュボードがあります。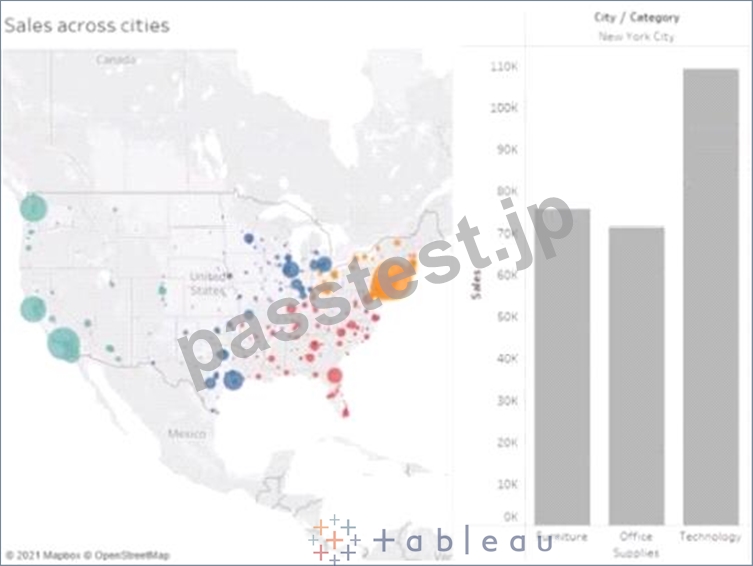
ユーザーがマップ上でのみを選択した場合、棒グラフのデータは選択した都市のデータのみを表示する必要があります。棒グラフのデータは、ユーザーが別の都市を選択した場合にのみ変更する必要があります ダッシュボード アクションをどのように構成する必要がありますか? (回答エリアのドロップダウンを使用して、正しいオプションを選択してください。)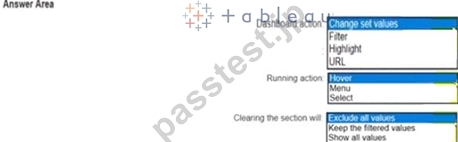
正解:
解説: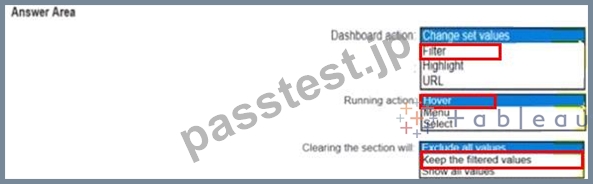
質問 # 55
以下のものがあります:
全体ランクとランクは、RANK 関数を使用する計算フィールドです。
[Ovorall Rank] - 1 のサブカテゴリをフィルターで除外します。
ランクの値が変更されるサブカテゴリはどれですか? 3つ選んでください。
- A. テーブル
- B. アクセサリ
- C. マシン
- D. 家具
- E. 椅子
- F. コピー機
- G. 本棚
- H. フォン
正解:A、B、C
解説:
In Tableau, the RANK function assigns a rank to each row within a partition of the data, based on the value of the field being ranked. It is important to understand that the rank is recalculated whenever the underlying data or the partitioning changes.
In the given scenario, the Overall Rank is based on the Sales figures, while the Rank (presumably) is based on the Sales within the Category. When filtering on the condition where [Overall Rank] - 1, it means we are excluding the sub-category that has an Overall Rank of 2.
Looking at the data:
Furnishings has an Overall Rank of 8, which does not meet the filter condition ([Overall Rank] - 1). Therefore, its rank remains the same.
Tables have an Overall Rank of 3. When the sub-category with an Overall Rank of 2 is removed (Chairs in this case), Tables move up in the overall ranking. However, since Tables are the top-ranked within the Furniture category, their Rank within the category would remain unchanged at 1.
Chairs have an Overall Rank of 2, which meets the filter condition and thus will be removed from the view. We cannot determine the change in Rank for Chairs because they are filtered out.
Accessories have an Overall Rank of 5. If any sub-category with a higher Overall Rank (1 to 4) is removed, the rank of Accessories within the Technology category could change because it is currently ranked 3 in its category. With the removal of Phones (Overall Rank 1), the Rank of Accessories could potentially increase.
Copiers have an Overall Rank of 6, which does not meet the filter condition. Therefore, its rank remains the same.
Machines have an Overall Rank of 4. If we remove Phones (Overall Rank 1), Machines will move up in the overall ranking and potentially within the Technology category as well, changing its Rank from 2 to 1.
Phones have an Overall Rank of 1, which does not meet the filter condition of being Overall Rank 2. Therefore, its rank remains the same.
Bookcases have an Overall Rank of 7, which does not meet the filter condition. Therefore, its rank remains the same.
Based on this analysis, when the sub-category with an Overall Rank of 2 (Chairs) is removed, the Rank value will change for Tables, Accessories, and Machines, as they will move up in the overall ranking within their respective categories. However, it's important to note that while Tables will move up in the overall ranking, their rank within the Furniture category would not change as they are already at the top. The rank changes for Accessories and Machines are due to the removal of Phones, which is ranked higher overall and within the Technology category.
質問 # 56
デスクトップにある Book1 へのリンクを開きます。スーパーストア データ ソースを使用します。
「顧客名」フィールドを「名」と「姓」という名前の 2 つのフィールドに分割します。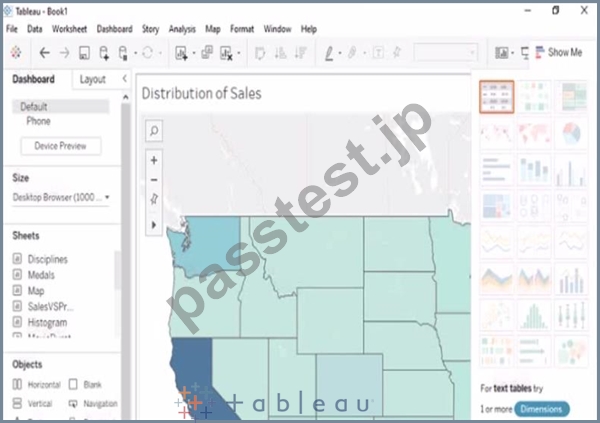
正解:
解説:
以下の説明の手順を確認してください。
Explanation:
To split the Customer Name field into two fields named First Name and Last Name, you need to do the following steps:
Open the link to Book1 found on the desktop. This will open the Tableau workbook that uses the Superstore data source.
Go to the Data Source tab at the bottom of the workbook to see the data source page. You will see a table that shows the fields and values from the Superstore data source.
Right-click on Customer Name in the table and select Split from the menu. This will split the field into two fields based on a separator, which is a space by default. You will see two new fields named Customer Name - Split 1 and Customer Name - Split 2 in the table.
Right-click on Customer Name - Split 1 and select Rename from the menu. Type First Name as the new name and press Enter. This will rename the field as First Name.
Right-click on Customer Name - Split 2 and select Rename from the menu. Type Last Name as the new name and press Enter. This will rename the field as Last Name.
質問 # 57
2 つのシートを含む次のダッシュボードを作成するとします。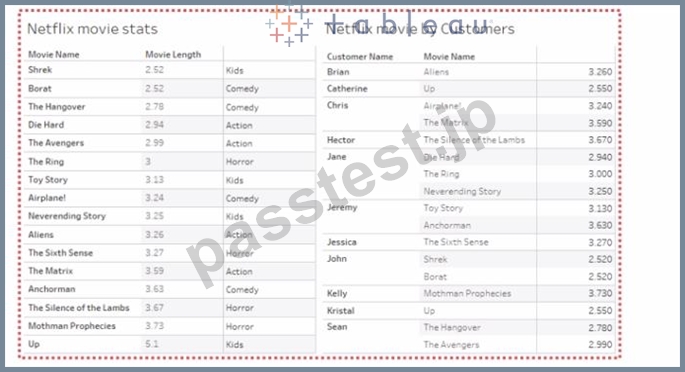
あなたは何をするべきか?
- A. 両方のシートを水平コンテナに追加し、コンテナに境界線を追加します。
- B. 両方のシートに境界線を追加し、両方のシートを水平オブジェクトに追加します。
- C. 両方のシートをダッシュボードにドラッグし、各シートに背景を追加します。
- D. 両方のシートをダッシュボードにドラッグし、各シートに枠線を追加します。
正解:A
質問 # 58
デスクトップにある Book1 へのリンクを開きます。ヒストグラム ワークシートを開き、Superstone データ ソースを使用します。
3 のビン サイズを使用して、Quantity フィールドのヒストグラムを作成します。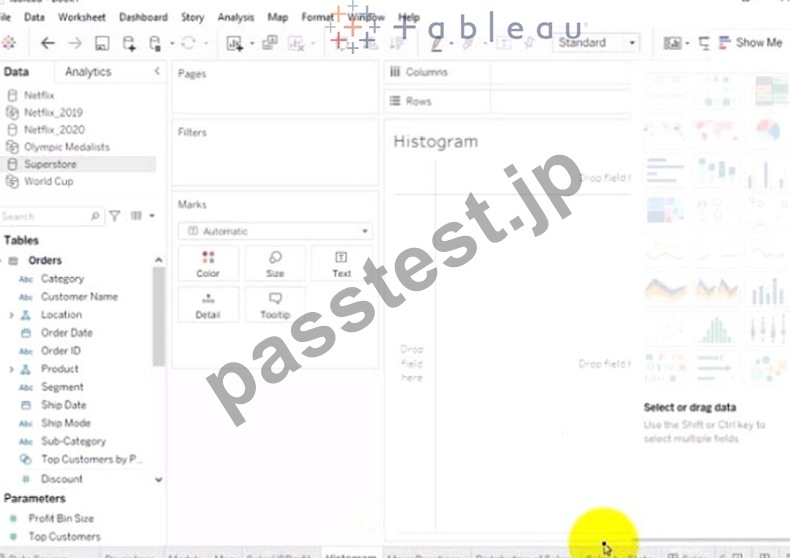
- A. をお送りください
- B. フィードバックをお送りください。
正解:B
質問 # 59
......
TDA-C01日本語試験練習テスト問題:https://www.passtest.jp/Tableau/TDA-C01-JPN-shiken.html