![]()
[2023年12月31日] あなたを合格させるTDA-C01日本語無料最新問題集でTableau練習テスト
無料でゲット!高評価Tableau TDA-C01日本語試験問題集を今すぐダウンロード!
質問 # 11
次のようなビジュアライゼーションが得られます。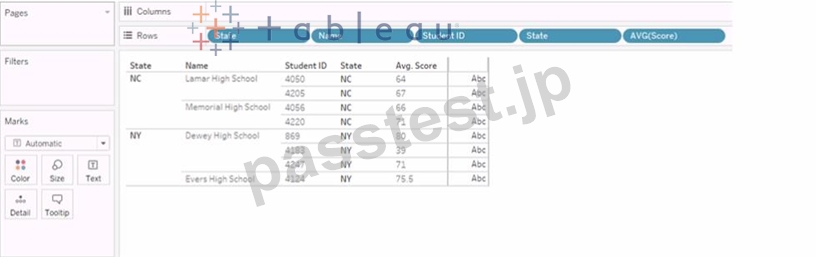
RANK(AVG([スコア]) という式を持つ Rank_Score という名前の表計算を作成し、Rank_Score をマーク カードのテキストにドラッグします。
学生 ID 4220 のランク スコア値は何ですか?
- A. 0
- B. 1
- C. 2
- D. 3
正解:D
解説:
the rank function returns the rank of each row within the partition of a result set. The rank of a row is one plus the number of ranks that come before the row in question.
To answer your question, we need to apply the rank function to the Avg Score column and sort it in descending order. Then we can find the rank score value for Student ID 4220 by looking at the corresponding row.
Here is how the table would look like after applying the rank function and sorting: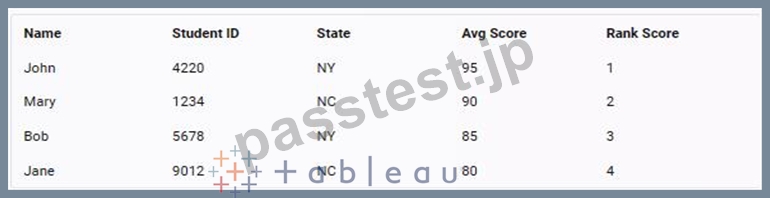
As you can see, the rank score value for Student ID 4220 is 1.
質問 # 12
あなたの会社には、米国とドイツに 2 つの部門があり、バッハ部門には別のデータベースがあります。以下は、米国における部門の売上データのサンプルです。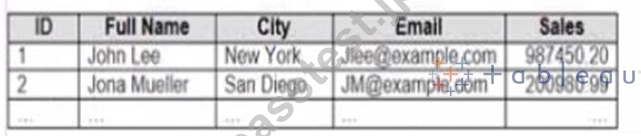
以下は、ドイツの me 部門の売上データのサンプルです。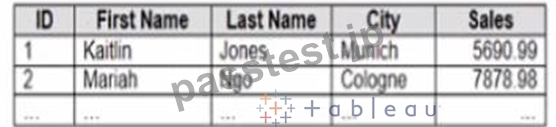
Populatio.csv という名前のファイルに人口データがあります。以下はデータのサンプルです。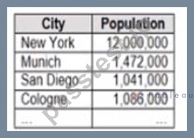
各営業担当者の 1 人あたりのタイ売上を ml で表示するビジュアライゼーションを作成する予定です。各営業担当者は、フルネームで識別される必要があります。
計画された視覚化をサポートするデータを準備する必要があります。データ ソースはパブリッシュをサポートしている必要があります。
どの 4 つのアクションを順番に実行する必要がありますか?
(4 つの正しい選択肢を順番に配置します。矢印を使用して選択肢を回答エリアの矢印に移動し、選択肢を並べ替えます。
オプションを並べ替えるには、回答エリアの矢印を使用します)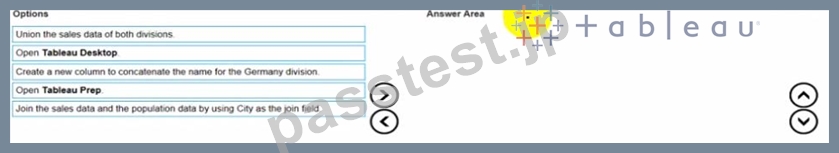
正解:
解説: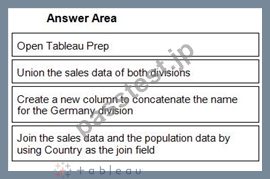
1 - Open Tableau Prep
2 - Union the sales data of both divisions
3 - Create a new column to concatenate the name for the Germany division
4 - Join the sales data and the population data by using Country as the join field
質問 # 13
Tableau Server に次のデータ ソースがあります。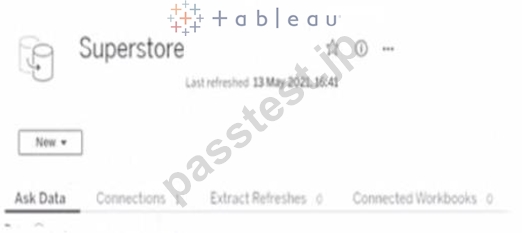
データが 1 時間ごとに更新されるようにする必要があります。
あなたは何を選ぶべきですか?
- A. 接続
- B. 新規
- C. 抽出の更新
- D. 接続されたワークブック
正解:C
解説:
To ensure that the data is updated every hour, you need to select Extract Refreshes from the data source menu on Tableau Server. This will allow you to add a new extract refresh schedule or edit an existing one. You can specify the frequency and time of the refresh, as well as any custom options or credentials. New will create a new data source, Connected Workbooks will show you which workbooks use this data source, and Connections will show you which tables or files are connected to this data source. Reference: https://help.tableau.com/current/server/en-us/refresh_extracts.htm https://help.tableau.com/current/server/en-us/refresh_extracts_add.htm
質問 # 14
Sheet1 Sheet2 および Sheet3 という名前の 3 つのワークシートを含む Tableau ワークブックがあります。
いくつかのフィルタを作成します。
[データ ソース] ページから、データ ソース フィラーを追加する予定です
[データ ソース フィルターの編集] ダイアログ ボックスにフィルターの種類が表示されるのはいつですか?
- A. ディメンション m Sheet3 のコンテキスト フィラー
- B. 全シートに次元マウ
- C. シートで使用される表計算フィルター
- D. シート 1 とシート 2 のディメンションの上位 N 条件ファイラー
正解:D
質問 # 15
デスクトップにある Book1 へのリンクを開きます。CategoryPercentage ワークシートを開きます。
棒グラフを変更して、すべてのカテゴリ内の各サブカテゴリの売上の割合を表示します。すべてのカテゴリの合計パーセンテージは 100% でなければなりません。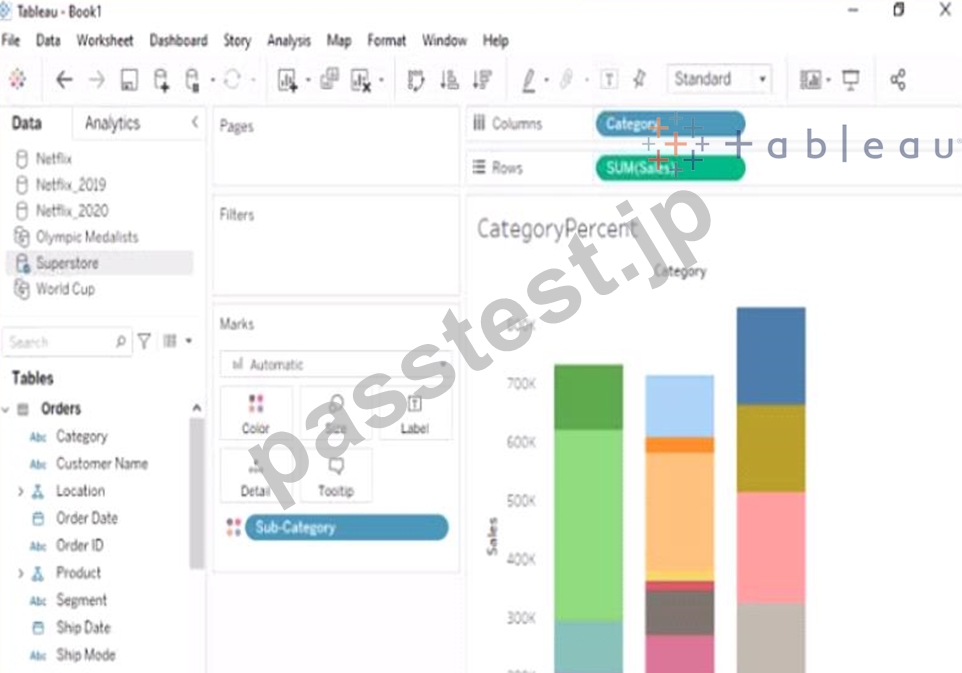
正解:
解説:
Send us your feedback on it
質問 # 16
月ごとの平均売上を示す次の折れ線グラフがあります。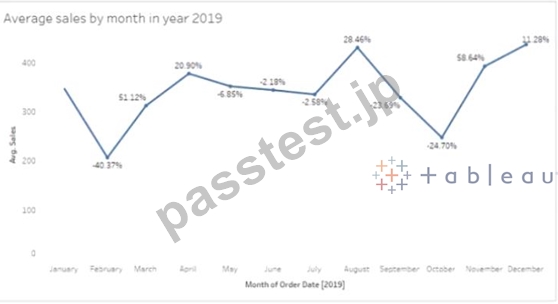
2019 年の前月と比較して、スエージの売上が最も増加したのはどの月ですか?
- A. 12月
- B. 8月
- C. 11月
- D. 10月
正解:C
質問 # 17
sales、City、および Region という名前のフィールドを含むデータベースがあります。
さまざまな都市での販売数を示す次のグラフがあります。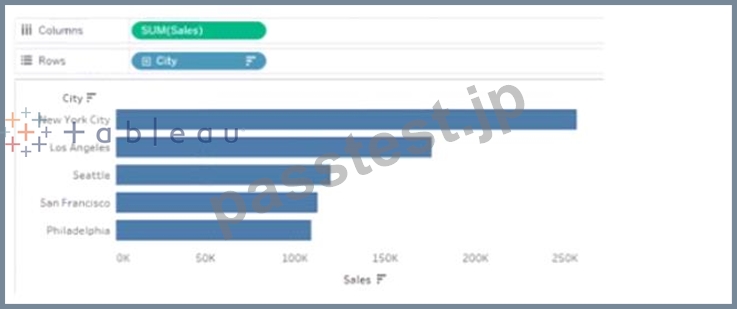
ユーザーがいずれかの棒の上にマウスを置いたときに、対応する領域を動的に表示したいとします。
あなたは何をするべきか?
- A. チャットで a を右クリックし、[注釈] を選択してから [マーク] を選択します。
- B. [領域] を [マーク] カードのツールヒントにドラッグします。
- C. グラフのバーを右クリックし、[ラベルをマーク] を選択してから、[常に表示] を選択します。
- D. City のエイリアスを編集します。
正解:A
質問 # 18
ダッシュボードを公開すると、attract が使用されます。抽出は毎週月曜日の 10:00 に更新されます。
抽出が月の最終日の 18:00 にも更新されるようにする必要があります。
あなたは何をするべきか?
- A. Tableau Server から。スケジュールを選択し、既存のスケジュールの優先度を変更します
- B. Tableau Server から。[スケジュール] を選択して抽出のスケジュールを見つけ、頻度を月の最終日に変更します。
- C. Tableau Server からワークブックを選択し、[抽出の更新] を選択してから、新しい抽出の更新を追加します。
- D. Tableau Desktop から [ワークブックのパブリッシュ] ダイアログ ボックスを開き、スケジュールを構成します。
正解:C
解説:
To refresh an extract on Tableau Server, you need to select the workbook, select Refresh Extracts, and then add a new extract refresh. You can specify the frequency and time of the refresh, as well as any custom options. You can have multiple extract refreshes for the same workbook with different schedules. Reference: https://help.tableau.com/current/server/en-us/refresh_extracts.htm https://help.tableau.com/current/server/en-us/refresh_extracts_add.htm
質問 # 19
1 つのシートを持つ次のタイル張りのダッシュボードがあります。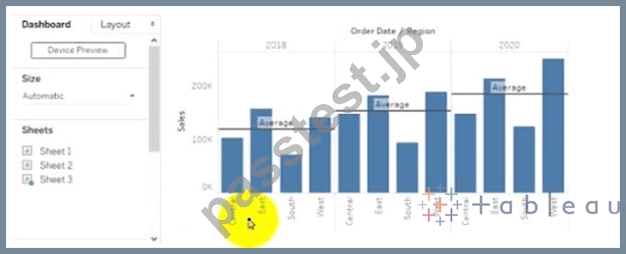
フィット シートを Sheet2 に置き換えます。
あなたは何をするべきか?
- A. Sheet3 のコンテキスト メニューから。選択する 選択解除
- B. Sheet2 をダッシュボードにドラッグします。
- C. Sheets を選択し、Sheet2 の横にある Swap Sheet ボタンをクリックします。
- D. Sheet2 を右クリックし、[ダッシュボードに追加] を選択します。
- E. Sheet3 のコンテキスト メニューから。[ダッシュボード アイテムの削除] を選択します
正解:D
質問 # 20
Tableau Desktop から Tableau Server サイトにサインインします。
パブリッシュされたデータ ソースを検索すると、利用可能なデータ ソースのリストに何が表示されますか?
- A. アクセス権のあるフォルダー内の Tableau Server にパブリッシュされたすべてのデータ ソース
- B. サイトに公開されたすべてのデータ ソース
- C. Tableau Server にパブリッシュされたすべてのデータ ソース
- D. アクセス権のあるフォルダー内のサイトに公開されたすべてのデータ ソース
正解:A
質問 # 21
sates データを含むデータセットがあります
を。以下はデータのサンプルです。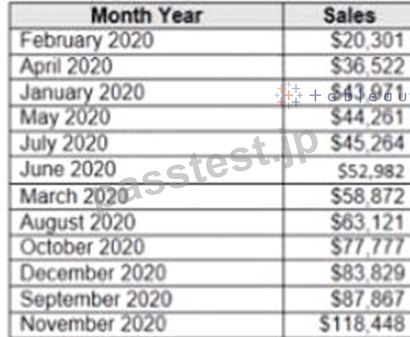
月の売り上げが $50 000 を超える場合は、true の値を返す必要があります。それ以外の場合、式は false の値を返す必要があります。
目標を達成する式はどれか 2 つ選択してください
- A. [Sales] > 50000
- B. IIF(SUM< [Sales] )>50000, TRUE, FALSE)
- C. SUM{[Sales]) IN (50000)
- D. MAX< [Sales], 50000)
正解:A、B
質問 # 22
Tableau ワークブックを Microsoft Excel スプレッドシートのデータセットに接続したいと考えています。
Tableau Desktop から何をすべきですか?
- A. [データ] メニューから [新しいデータ ソース] を選択します。
- B. [ファイル] メニューから [ワークブックのインポート] を選択します。
- C. [データ] メニューから [データ ソースの置換] を選択します。
- D. [ファイル] メニューから [新規] を選択します。
正解:A
解説:
To connect a Tableau workbook to a dataset in a Microsoft Excel spreadsheet, you need to select New Data Source from the Data menu. This will open the Connect pane, where you can choose Microsoft Excel as your data source and browse for your spreadsheet file. You can then drag and drop your sheets or tables to join or union them in the data source page. Reference: https://help.tableau.com/current/pro/desktop/en-us/connect_basic.htm https://help.tableau.com/current/pro/desktop/en-us/connect_excel.htm
質問 # 23
デスクトップにある Book1 へのリンクを開きます。Line ワークシートを開きます。
グラフを変更して、各地域の両方のメジャーのメイン値と最大値のみを表示します。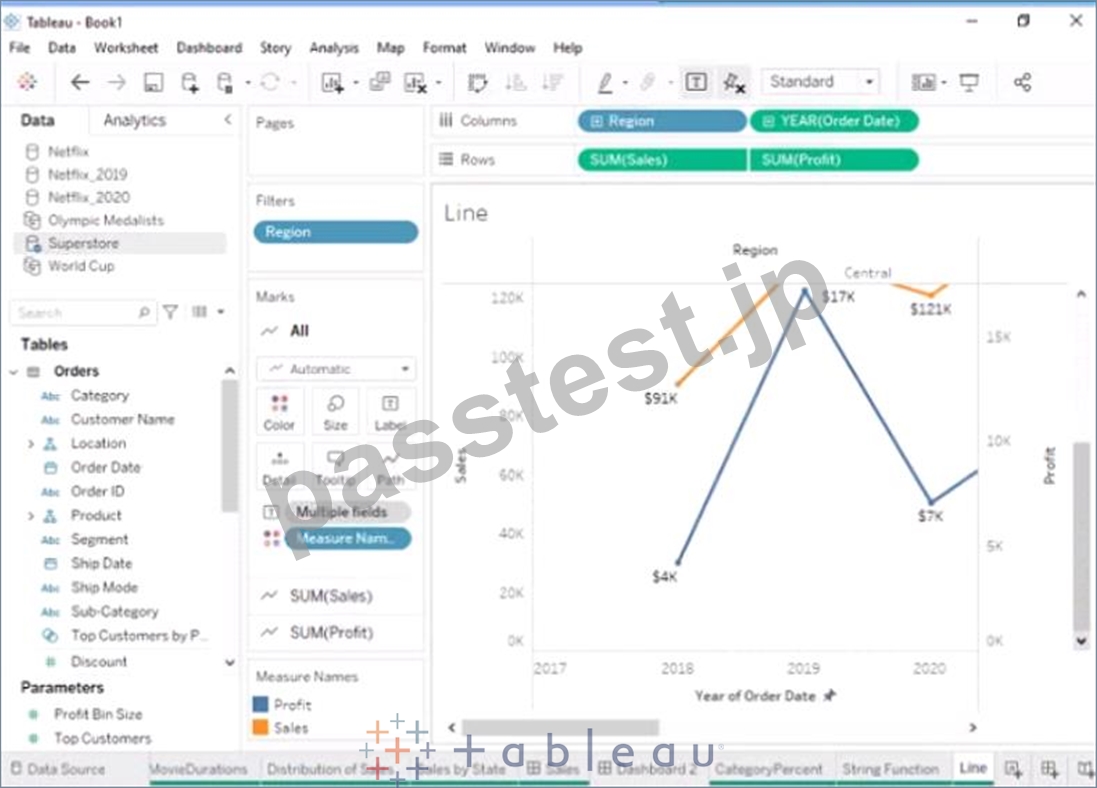
- A. フィードバックをお送りください。
- B. をお送りください
正解:A
質問 # 24
2017 年から現在までのビジネス セグメントごとの毎日の売上を含むデータセットがあります 月次の履歴トレンドを使用して、将来のセグメントごとの売上を予測したい 注文時に実行する必要がある 3 つのアクションはどれですか?
(3 つの正しい選択肢を順番に配置するには、矢印を使用して選択肢を回答エリア I 回答エリア内に移動し、選択肢を並べ替えます。)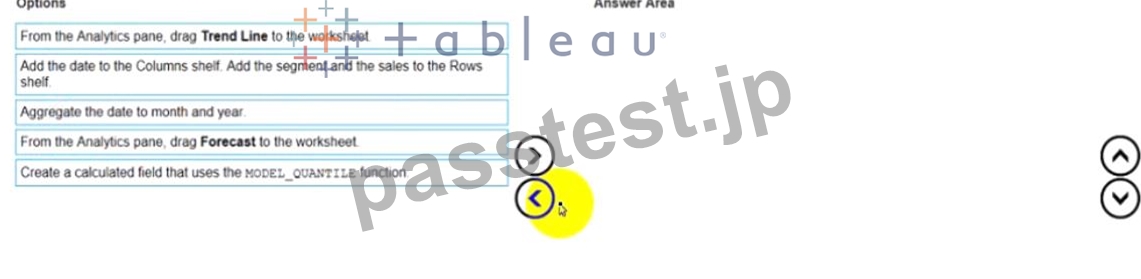
正解:
解説: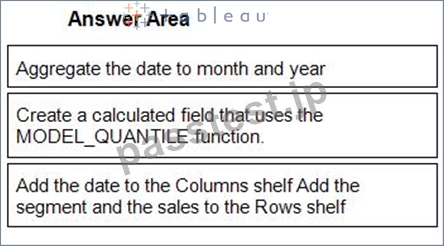
1 - Aggregate the date to month and year
2 - Create a calculated field that uses the MODEL_QUANTILE function.
3 - Add the date to the Columns shelf Add the segment and the sales to the Rows shelf
質問 # 25
Choose Region という名前のパラメーターを作成すると、Region という名前のフィールドからの値が含まれます。
ユーザーが [地域の選択] パラメーターを使用して、異なる地域間でログを記録することにより、チャートを操作できるようにしたい 次に何をすべきか?
- A. Choose Region パラメータを Single Value (リスト) に設定します。
- B. [Region] = [choose Region) 式をフィルター カードに追加します。
- C. Region を me Fitters カードに追加します
- D. [地域の選択] パラメーターを [ページ] カードに追加します。
正解:B
解説:
To use the Choose Region parameter to interact with a chart by toggling between different regions, you should add the [Region] = [Choose Region] formula to the Filters card. This formula will create a boolean filter that returns TRUE if the value in the Region field matches the value in the Choose Region parameter, and FALSE otherwise. You can add this formula to the Filters card by right-clicking on it and selecting Add Filter from the menu. Then you can select Condition from the dialog box and enter the formula in the text box. This will filter the chart to show only the data for the selected region.
The other options are not correct for this scenario. Adding Region to the Filters card will create a categorical filter that shows a list of values from the Region field, but it will not use the Choose Region parameter. Adding the Choose Region parameter to the Pages card will create a page control that allows you to cycle through different values of the parameter, but it will not filter the chart. Setting the Choose Region parameter to Single Value (list) will change how the parameter control appears on the worksheet, but it will not affect how it interacts with the chart. Reference: https://help.tableau.com/current/pro/desktop/en-us/parameters.htm https://help.tableau.com/current/pro/desktop/en-us/filtering.htm https://help.tableau.com/current/pro/desktop/en-us/filtering_condition.htm
質問 # 26
デスクトップにある Book1 へのリンクを開きます。ヒストグラム ワークシートを開き、Superstone データ ソースを使用します。
3 のビン サイズを使用して、Quantity フィールドのヒストグラムを作成します。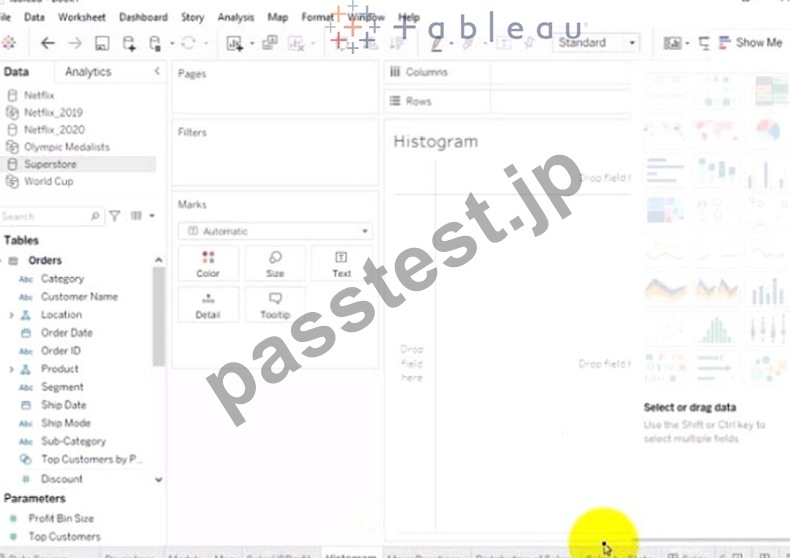
- A. フィードバックをお送りください。
- B. をお送りください
正解:A
質問 # 27
[ワークシート] メニューからワークシートをエクスポートできる 3 つの形式はどれですか? 3つ選ぶ
- A. .csv
- B. .txt
- C. .html
- D. .pptx
- E. .xlsx
- F. .png
正解:A、C、F
質問 # 28
次のビジュアライゼーションがあります。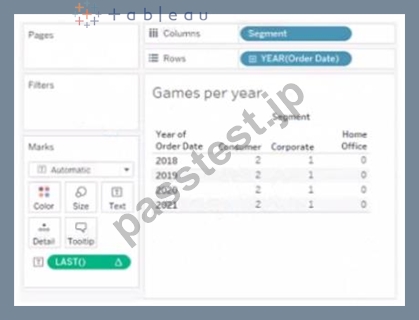
Last() 計算は、テーブル (横) を使用して計算するように設定されています
Oder Dale を使用するように計算を変更した場合、2018 年の消費者セグメントのクロス集計に表示される値はどれですか?
- A. 0
- B. 1
- C. 2
- D. 3
正解:D
解説:
The value that will appear in the crosstab for the Consumer segment of the year 2018 if you change compute to use Order Date is 0. The Last() calculation is a table calculation that returns the number of rows from the current row to the last row in the partition. The partition is determined by how you compute the calculation. In this case, you change compute to use Order Date, which means that the calculation will be performed for each value of Order Date.
The crosstab shows that there are two values of Order Date for the Consumer segment of the year 2018: Q1 and Q4. The Last() calculation will return 0 for Q4, because it is the last row in the partition. It will return 1 for Q1, because it is one row away from the last row in the partition.
The other options are not correct for this scenario. The Last() calculation will not return 2, 3, or 4 for any value of Order Date, because there are only two values in each partition.
質問 # 29
あなたはアラートの所有者です。
アラートが一時停止されたという電子メール通知を受け取りました。 一時停止されたアラートはどこから再開できますか?
- A. Tableau Prep の通知領域
- B. Tableau Desktop のデータ ソース ページ
- C. Tableau Web ページの [マイ コンテンツ] 領域
- D. Ma と共有ページ
正解:D
質問 # 30
......
一発合格の秘訣は無料でゲット!TDA-C01日本語Certified 試験エンジンPDF:https://www.passtest.jp/Tableau/TDA-C01-JPN-shiken.html