

[2026年01月] 学習材料には有効なNCM-MCI効率的問題集!
最新のNCM-MCIテストエンジンPDF無料問題集保証!
質問 # 10
Task 3
An administrator needs to assess performance gains provided by AHV Turbo at the guest level. To perform the test the administrator created a Windows 10 VM named Turbo with the following configuration.
1 vCPU
8 GB RAM
SATA Controller
40 GB vDisk
The stress test application is multi-threaded capable, but the performance is not as expected with AHV Turbo enabled. Configure the VM to better leverage AHV Turbo.
Note: Do not power on the VM. Configure or prepare the VM for configuration as best you can without powering it on.
正解:
解説:
See the Explanation for step by step solution
Explanation:
To configure the VM to better leverage AHV Turbo, you can follow these steps:
Log in to Prism Element of cluster A using the credentials provided.
Go to VM > Table and select the VM named Turbo.
Click on Update and go to Hardware tab.
Increase the number of vCPUs to match the number of multiqueues that you want to enable. For example, if you want to enable 8 multiqueues, set the vCPUs to 8. This will improve the performance of multi-threaded workloads by allowing them to use multiple processors.
Change the SCSI Controller type from SATA to VirtIO. This will enable the use of VirtIO drivers, which are required for AHV Turbo.
Click Save to apply the changes.
Power off the VM if it is running and mount the Nutanix VirtIO ISO image as a CD-ROM device. You can download the ISO image from Nutanix Portal.
Power on the VM and install the latest Nutanix VirtIO drivers for Windows 10. You can follow the instructions from Nutanix Support Portal.
After installing the drivers, power off the VM and unmount the Nutanix VirtIO ISO image.
Power on the VM and log in to Windows 10.
Open a command prompt as administrator and run the following command to enable multiqueue for the VirtIO NIC:
ethtool -L eth0 combined 8
Replace eth0 with the name of your network interface and 8 with the number of multiqueues that you want to enable. You can use ipconfig /all to find out your network interface name.
Restart the VM for the changes to take effect.
You have now configured the VM to better leverage AHV Turbo. You can run your stress test application again and observe the performance gains.
https://portal.nutanix.com/page/documents/kbs/details?targetId=kA00e000000LKPdCAO change vCPU to 2/4 ?
Change SATA Controller to SCSI:
acli vm.get Turbo
Output Example:
Turbo {
config {
agent_vm: False
allow_live_migrate: True
boot {
boot_device_order: "kCdrom"
boot_device_order: "kDisk"
boot_device_order: "kNetwork"
uefi_boot: False
}
cpu_passthrough: False
disable_branding: False
disk_list {
addr {
bus: "ide"
index: 0
}
cdrom: True
device_uuid: "994b7840-dc7b-463e-a9bb-1950d7138671"
empty: True
}
disk_list {
addr {
bus: "sata"
index: 0
}
container_id: 4
container_uuid: "49b3e1a4-4201-4a3a-8abc-447c663a2a3e"
device_uuid: "622550e4-fb91-49dd-8fc7-9e90e89a7b0e"
naa_id: "naa.6506b8dcda1de6e9ce911de7d3a22111"
storage_vdisk_uuid: "7e98a626-4cb3-47df-a1e2-8627cf90eae6"
vmdisk_size: 10737418240
vmdisk_uuid: "17e0413b-9326-4572-942f-68101f2bc716"
}
flash_mode: False
hwclock_timezone: "UTC"
machine_type: "pc"
memory_mb: 2048
name: "Turbo"
nic_list {
connected: True
mac_addr: "50:6b:8d:b2:a5:e4"
network_name: "network"
network_type: "kNativeNetwork"
network_uuid: "86a0d7ca-acfd-48db-b15c-5d654ff39096"
type: "kNormalNic"
uuid: "b9e3e127-966c-43f3-b33c-13608154c8bf"
vlan_mode: "kAccess"
}
num_cores_per_vcpu: 2
num_threads_per_core: 1
num_vcpus: 2
num_vnuma_nodes: 0
vga_console: True
vm_type: "kGuestVM"
}
is_rf1_vm: False
logical_timestamp: 2
state: "Off"
uuid: "9670901f-8c5b-4586-a699-41f0c9ab26c3"
}
acli vm.disk_create Turbo clone_from_vmdisk=17e0413b-9326-4572-942f-68101f2bc716 bus=scsi remove the old disk acli vm.disk_delete 17e0413b-9326-4572-942f-68101f2bc716 disk_addr=sata.0
質問 # 11
Task 8
Depending on the order you perform the exam items, the access information and credentials could change. Please refer to the other item performed on Cluster B if you have problems accessing the cluster.
The infosec team has requested that audit logs for API Requests and replication capabilities be enabled for all clusters for the top 4 severity levels and pushed to their syslog system using highest reliability possible. They have requested no other logs to be included.
Syslog configuration:
Syslog Name: Corp_syslog
Syslop IP: 34.69.43.123
Port: 514
Ensure the cluster is configured to meet these requirements.
正解:
解説:
See the Explanation for step by step solution
Explanation:
To configure the cluster to meet the requirements of the infosec team, you need to do the following steps:
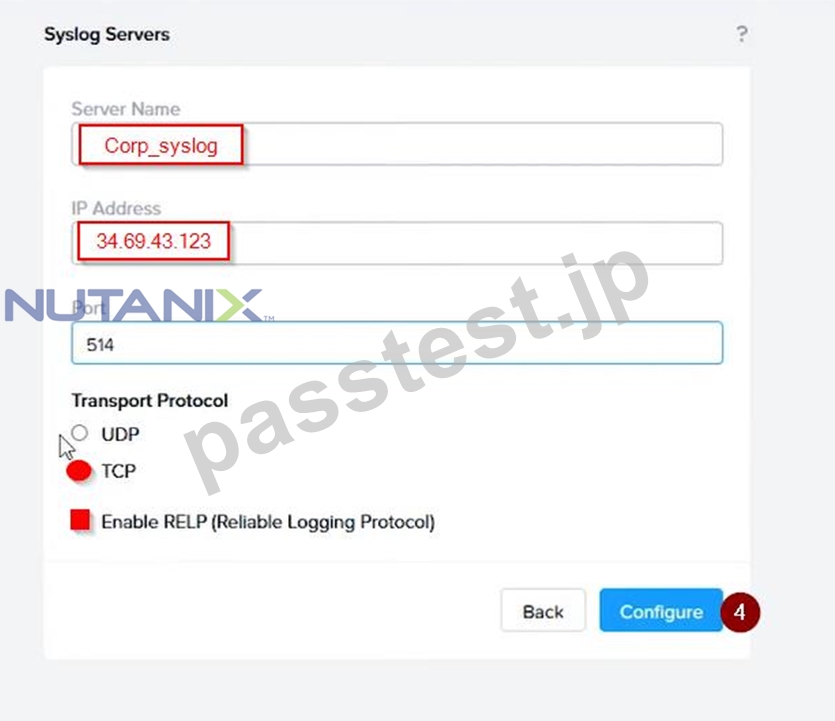
Log in to Prism Central and go to Network > Syslog Servers > Configure Syslog Server. Enter Corp_syslog as the Server Name, 34.69.43.123 as the IP Address, and 514 as the Port. Select TCP as the Transport Protocol and enable RELP (Reliable Logging Protocol). This will create a syslog server with the highest reliability possible.
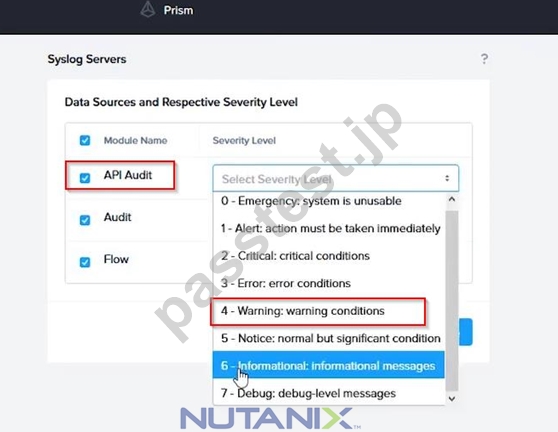
Click Edit against Data Sources and select Cluster B as the cluster. Select API Requests and Replication as the data sources and set the log level to CRITICAL for both of them. This will enable audit logs for API requests and replication capabilities for the top 4 severity levels (EMERGENCY, ALERT, CRITICAL, and ERROR) and push them to the syslog server. Click Save.
Repeat step 2 for any other clusters that you want to configure with the same requirements.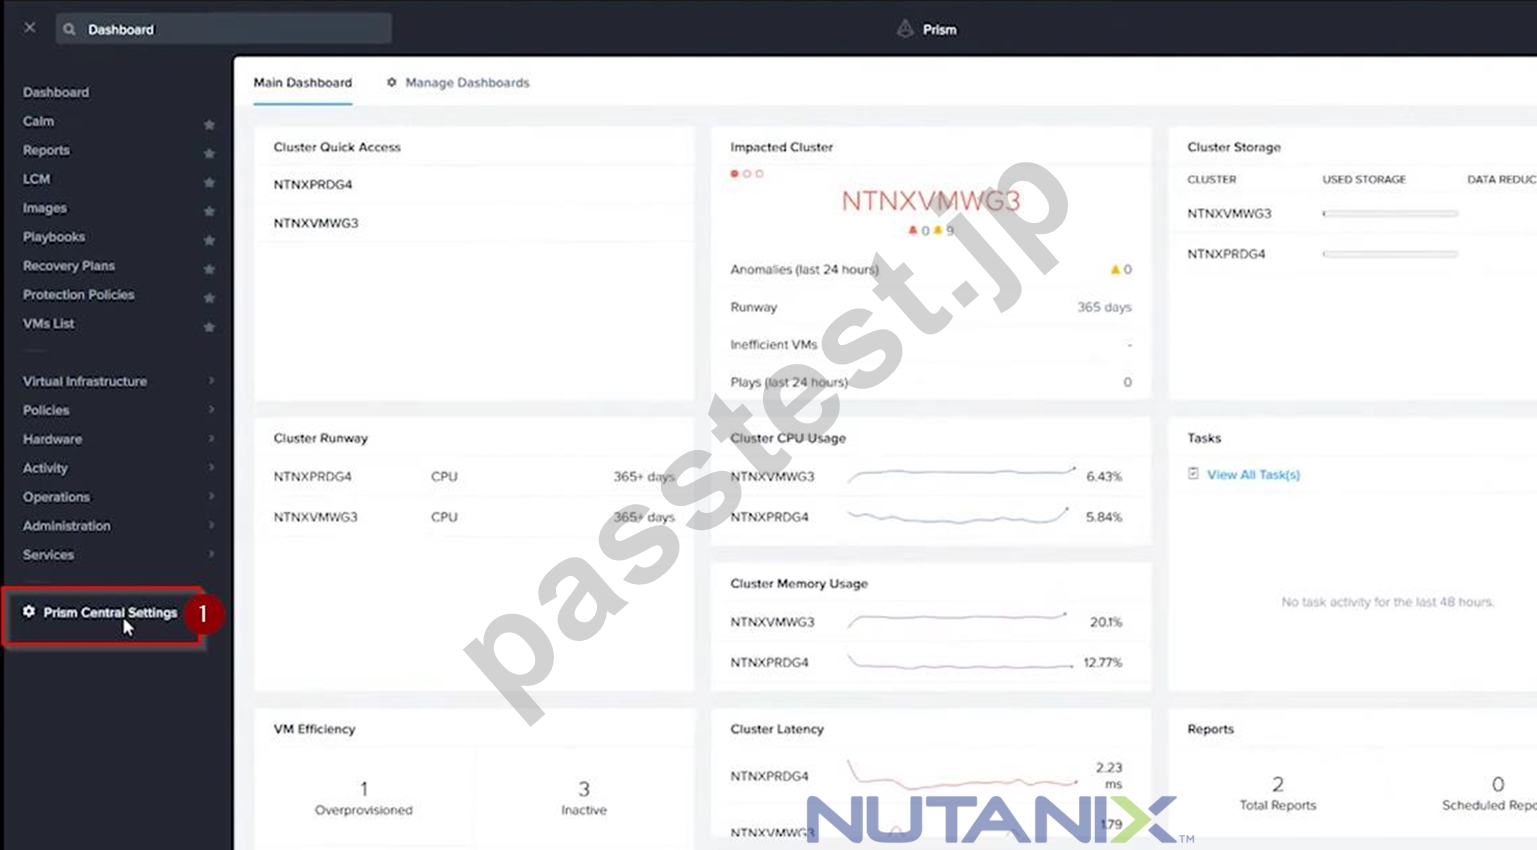
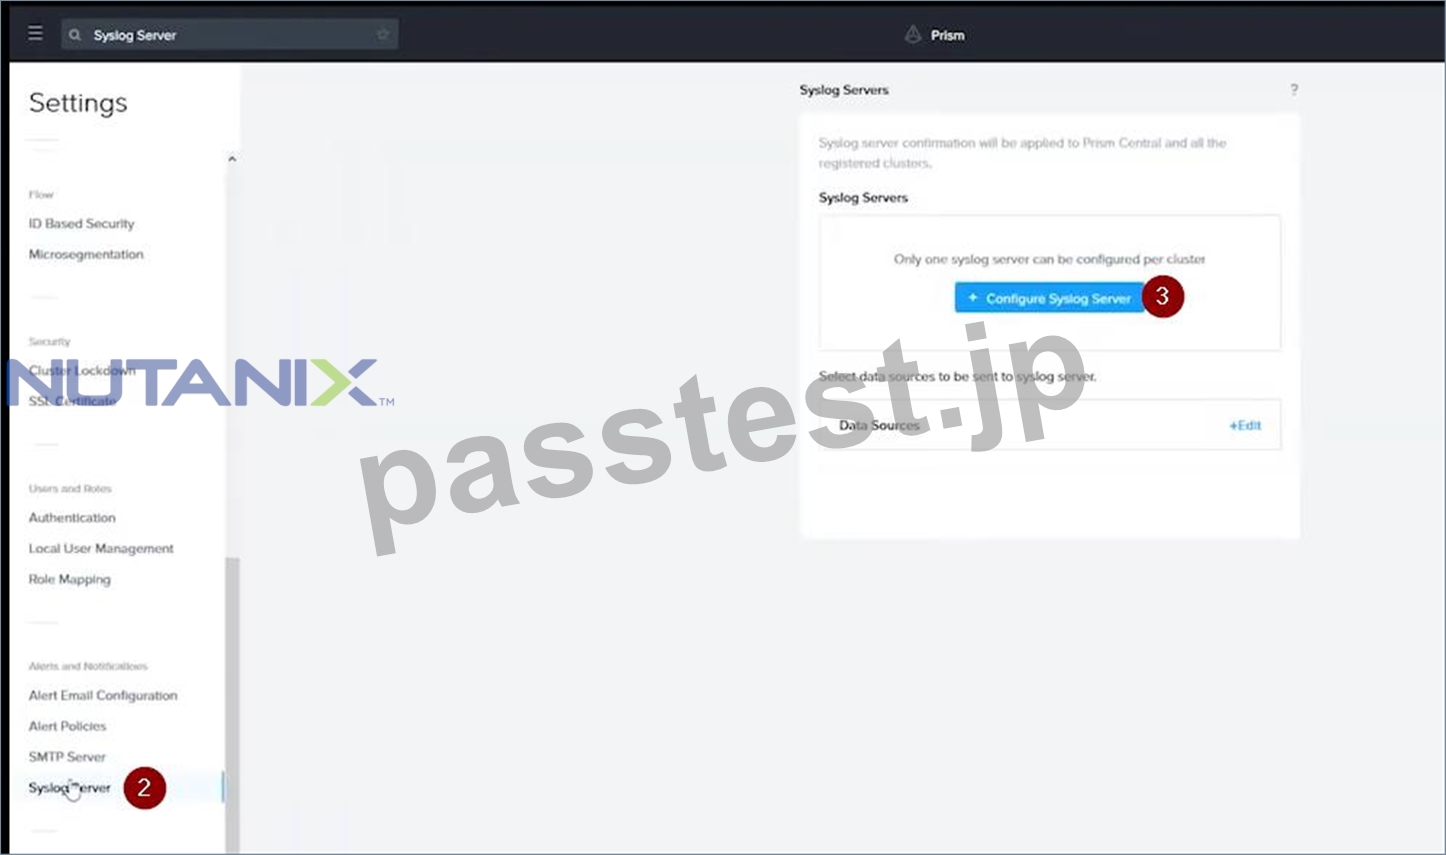
To configure the Nutanix clusters to enable audit logs for API Requests and replication capabilities, and push them to the syslog system with the highest reliability possible, you can follow these steps:
Log in to the Nutanix Prism web console using your administrator credentials.
Navigate to the "Settings" section or the configuration settings interface within Prism.
Locate the "Syslog Configuration" or "Logging" option and click on it.
Configure the syslog settings as follows:
Syslog Name: Enter "Corp_syslog" as the name for the syslog configuration.
Syslog IP: Set the IP address to "34.69.43.123", which is the IP address of the syslog system.
Port: Set the port to "514", which is the default port for syslog.
Enable the option for highest reliability or persistent logging, if available. This ensures that logs are sent reliably and not lost in case of network interruptions.
Save the syslog configuration.
Enable Audit Logs for API Requests:
In the Nutanix Prism web console, navigate to the "Cluster" section or the cluster management interface.
Select the desired cluster where you want to enable audit logs.
Locate the "Audit Configuration" or "Security Configuration" option and click on it.
Look for the settings related to audit logs and API requests. Enable the audit logging feature and select the top 4 severity levels to be logged.
Save the audit configuration.
Enable Audit Logs for Replication Capabilities:
In the Nutanix Prism web console, navigate to the "Cluster" section or the cluster management interface.
Select the desired cluster where you want to enable audit logs.
Locate the "Audit Configuration" or "Security Configuration" option and click on it.
Look for the settings related to audit logs and replication capabilities. Enable the audit logging feature and select the top 4 severity levels to be logged.
Save the audit configuration.
After completing these steps, the Nutanix clusters will be configured to enable audit logs for API Requests and replication capabilities. The logs will be sent to the specified syslog system with the highest reliability possible.
ncli
<ncli> rsyslog-config set-status enable=false
<ncli> rsyslog-config add-server name=Corp_Syslog ip-address=34.69.43.123 port=514 network-protocol=tdp relp-enabled=false
<ncli> rsyslog-config add-module server-name= Corp_Syslog module-name=APLOS level=INFO
<ncli> rsyslog-config add-module server-name= Corp_Syslog module-name=CEREBRO level=INFO
<ncli> rsyslog-config set-status enable=true
https://portal.nutanix.com/page/documents/kbs/details?targetId=kA00e0000009CEECA2
質問 # 12
TASK2
The security team has provided some new security requirements for cluster level security on Cluster 2.
Security requirements:
Update the password for the root user on the Cluster 2 node to match the admin user password.
Note: The 192.168.x.x network is not available. To access a node use the host IP (172.30.0.x) from the CVM.
Output the cluster-wide configuration of the SCMA policy to desktop\output.txt before changes are made.
Enable the Advanced Intrusion Detection Environment (AIDE) to run on a weekly basis for the hypervisor and cvms for Cluster 2.
Enable high-strength password policies for the hypervisor and cluster.
Ensure CVMs require SSH keys for login instead of passwords. (SSH keys are located in the desktop\Files\SSH folder.) Ensure the cluster meets these requirements. Do not reboot any cluster components.
Note: Please ensure you are modifying the correct components.
正解:
解説:
See the Explanation
Explanation:
This task focuses on Security Technical Implementation Guides (STIGs) and general hardening of the Nutanix cluster. Most of these tasks are best performed via the Nutanix Command Line Interface (ncli) on the CVM, though the SSH key requirement is often easier to handle via the Prism GUI.
Here is the step-by-step procedure to complete Task 2.
Prerequisites: Connection
Open PuTTY (or the available terminal) from the provided Windows Desktop.
SSH into the Cluster 2 CVM. (If the Virtual IP is unknown, check Prism Element for the CVM IP).
Log in using the provided credentials (usually nutanix / nutanix/4u or the admin password provided in your instructions).
Step 1: Output SCMA Policy (Do this FIRST)
Requirement: Output the cluster-wide configuration of the SCMA policy to desktop\output.txt before changes are made.
In the SSH session on the CVM, run:
Bash
ncli cluster get-software-config-management-policy
Copy the output from the terminal window.
Open Notepad on the Windows Desktop.
Paste the output.
Save the file as output.txt on the Desktop.
Step 2: Enable AIDE (Weekly)
Requirement: Enable the Advanced Intrusion Detection Environment (AIDE) to run on a weekly basis for the hypervisor and CVMs.
In the same CVM SSH session, run the following command to modify the SCMA policy:
Bash
ncli cluster edit-software-config-management-policy enable-aide=true schedule-interval=WEEKLY (Note: This single command applies the policy to both Hypervisor and CVMs by default in most versions).
Step 3: Enable High-Strength Password Policies
Requirement: Enable high-strength password policies for the hypervisor and cluster.
Run the following command:
Bash
ncli cluster set-high-strength-password-policy enable=true
Step 4: Update Root Password for Cluster Nodes
Requirement: Update the password for the root user on the Cluster 2 node to match the admin user password.
Method A: The Automated Way (Recommended)
Use ncli to set the password for all hypervisor nodes at once without needing to SSH into them individually.
Run:
Bash
ncli cluster set-hypervisor-password
When prompted, enter the current admin password (this becomes the new root password).
Method B: The Manual Way (If NCLI fails or manual access is required)
Note: Use this if the exam specifically wants you to touch the node via the 172.x network.
From the CVM, SSH to the host using the internal IP:
Bash
ssh [email protected] (Replace x with the host ID, e.g., 4 or 5)
Run the password change command:
Bash
passwd
Enter the admin password twice.
Repeat for other nodes in Cluster 2.
Step 5: Cluster Lockdown (SSH Keys)
Requirement: Ensure CVMs require SSH keys for login instead of passwords.
It is safest to do this via the Prism Element GUI to prevent locking yourself out.
Open Prism Element for Cluster 2 in the browser.
Click the Gear Icon (Settings) -> Cluster Lockdown.
Uncheck the box "Enable Remote Login with Password".
Click New Public Key (or Add Key).
Open the folder Desktop\Files\SSH on the Windows desktop.
Open the public key file (usually ends in .pub) in Notepad and copy the contents.
Paste the key into the Prism "Key" box.
Click Save.
Note: Do not reboot the cluster. The SCMA and Password policies take effect immediately without a reboot.
質問 # 13
Task 13
The application team is reporting performance degradation for a business-critical application that runs processes all day on Saturdays.
The team is requesting monitoring or processor, memory and storage utilization for the three VMs that make up the database cluster for the application: ORA01, ORA02 and ORA03.
The report should contain tables for the following:
At the cluster level, only for the current cluster:
The maximum percentage of CPU used
At the VM level, including any future VM with the prefix ORA:
The maximum time taken to process I/O Read requests
The Maximum percentage of time a VM waits to use physical CPU, out of the local CPU time allotted to the VM.
The report should run on Sundays at 12:00 AM for the previous 24 hours. The report should be emailed to [email protected] when competed.
Create a report named Weekends that meets these requirements
Note: You must name the report Weekends to receive any credit. Any other objects needed can be named as you see fit. SMTP is not configured.
A: Click Next.
Click on Add to add this custom view to your report. Click Next.
Under the Report Settings option, select Weekly from the Schedule drop-down menu and choose Sunday as the day of week. Enter 12:00 AM as the time of day. Enter [email protected] as the Email Recipient. Select CSV as the Report Output Format. Click Next.
Review the report details and click Finish.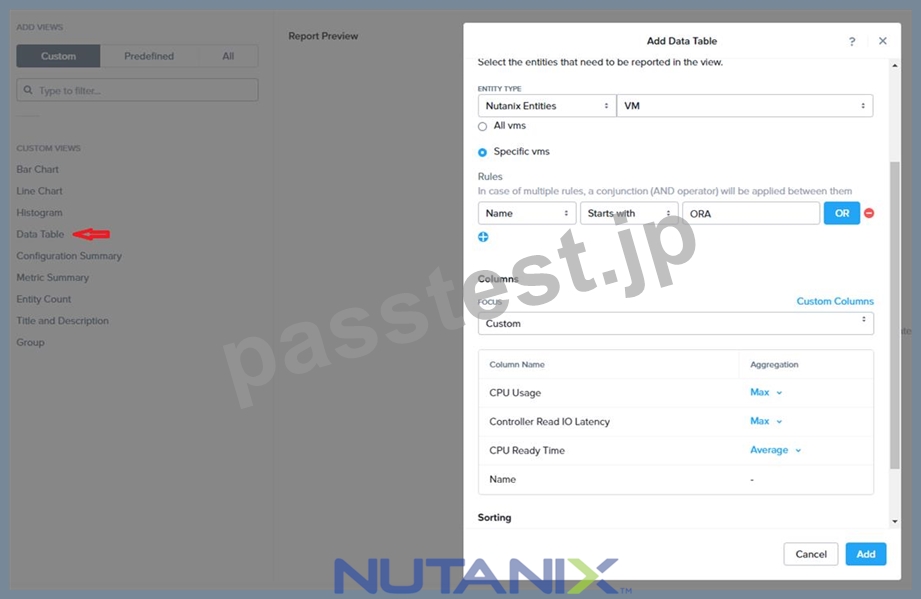
正解:
解説:
See the Explanation for step by step solution
Explanation:
To create a report named Weekends that meets the requirements, you can follow these steps:
Log in to Prism Central and click on Entities on the left menu.
Select Virtual Machines from the drop-down menu and click on Create Report.
Enter Weekends as the report name and a description if required. Click Next.
Under the Custom Views section, select Data Table. Click Next.
Under the Entity Type option, select Cluster. Click Next.
Under the Custom Columns option, add the following variable: CPU Usage (%). Click Next.
Under the Aggregation option for CPU Usage (%), select Max. Click Next.
Under the Filter option, select Current Cluster from the drop-down menu. Click Next.
Click on Add to add this custom view to your report. Click Next.
Under the Custom Views section, select Data Table again. Click Next.
Under the Entity Type option, select VM. Click Next.
Under the Custom Columns option, add the following variables: Name, I/O Read Latency (ms), VM Ready Time (%). Click Next.
Under the Aggregation option for I/O Read Latency (ms) and VM Ready Time (%), select Max. Click Next.
Under the Filter option, enter ORA* in the Name field. This will include any future VM with the prefix OR
質問 # 14
Task4
An administrator will be deploying Flow Networking and needs to validate that the environment, specifically switch vs1, is appropriately configured. Only VPC traffic should be carried by the switch.
Four versions each of two possible commands have been placed in Desktop\Files\Network\flow.txt. Remove the hash mark (#) from the front of correct First command and correct Second command and save the file.
Only one hash mark should be removed from each section. Do not delete or copy lines, do not add additional lines. Any changes other than removing two hash marks (#) will result in no credit.
Also, SSH directly to any AHV node (not a CVM) in the cluster and from the command line display an overview of the Open vSwitch configuration. Copy and paste this to a new text file named Desktop\Files\Network\AHVswitch.txt.
Note: You will not be able to use the 192.168.5.0 network in this environment.
First command
#net.update_vpc_traffic_config virtual_switch=vs0
net.update_vpc_traffic_config virtual_switch=vs1
#net.update_vpc_east_west_traffic_config virtual_switch=vs0
#net.update_vpc_east_west_traffic_config virtual_switch=vs1
Second command
#net.update_vpc_east_west_traffic_config permit_all_traffic=true
net.update_vpc_east_west_traffic_config permit_vpc_traffic=true
#net.update_vpc_east_west_traffic_config permit_all_traffic=false
#net.update_vpc_east_west_traffic_config permit_vpc_traffic=false
正解:
解説:
See the Explanation for step by step solution
Explanation:
First, you need to open the Prism Central CLI from the Windows Server 2019 workstation. You can do this by clicking on the Start menu and typing "Prism Central CLI". Then, you need to log in with the credentials provided to you.
Second, you need to run the two commands that I have already given you in Desktop\Files\Network\flow.txt. These commands are:
net.update_vpc_traffic_config virtual_switch=vs1 net.update_vpc_east_west_traffic_config permit_vpc_traffic=true These commands will update the virtual switch that carries the VPC traffic to vs1, and update the VPC east-west traffic configuration to allow only VPC traffic. You can verify that these commands have been executed successfully by running the command:
net.get_vpc_traffic_config
This command will show you the current settings of the virtual switch and the VPC east-west traffic configuration.
Third, you need to SSH directly to any AHV node (not a CVM) in the cluster and run the command:
ovs-vsctl show
This command will display an overview of the Open vSwitch configuration on the AHV node. You can copy and paste the output of this command to a new text file named Desktop\Files\Network\AHVswitch.txt.
You can use any SSH client such as PuTTY or Windows PowerShell to connect to the AHV node. You will need the IP address and the credentials of the AHV node, which you can find in Prism Element or Prism Central.
remove # from greens
On AHV execute:
sudo ovs-vsctl show
CVM access AHV access command
nutanix@NTNX-A-CVM:192.168.10.5:~$ ssh [email protected] "ovs-vsctl show" Open AHVswitch.txt and copy paste output
質問 # 15
Task 15
An administrator found a CentOS VM, Cent_Down, on the cluster with a corrupted network stack. To correct the issue, the VM will need to be restored from a previous snapshot to become reachable on the network again.
VM credentials:
Username: root
Password: nutanix/4u
Restore the VM and ensure it is reachable on the network by pinging 172.31.0.1 from the VM.
Power off the VM before proceeding.
正解:
解説:
See the Explanation for step by step solution
Explanation:
To restore the VM and ensure it is reachable on the network, you can follow these steps:
Log in to the Web Console of the cluster where the VM is running.
Click on Virtual Machines on the left menu and find Cent_Down from the list. Click on the power icon to power off the VM.
Click on the snapshot icon next to the power icon to open the Snapshot Management window.
Select a snapshot from the list that was taken before the network stack was corrupted. You can use the date and time information to choose a suitable snapshot.
Click on Restore VM and confirm the action in the dialog box. Wait for the restore process to complete.
Click on the power icon again to power on the VM.
Log in to the VM using SSH or console with the username and password provided.
Run the command ping 172.31.0.1 to verify that the VM is reachable on the network. You should see a reply from the destination IP address.
Go to VMS from the prism central gui
Select the VMand go to More -> Guest Shutdown
Go to Snapshots tab and revert to latest snapshot available
power on vm and verify if ping is working
質問 # 16
Task 10
An administrator is working to create a VM using Nutanix V3 API calls with the following specifications.
* VM specifications: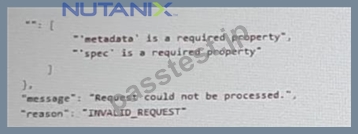
* vCPUs: 2
* Memory: BGb
* Disk Size: 50Gb
* Cluster: Cluster A
* Network: default- net
The API call is falling, indicating an issue with the payload:
The body is saved in Desktop/ Files/API_Create_VM,text
Correct any issues in the text file that would prevent from creating the VM. Also ensure the VM will be created as speeded and make sure it is saved for re-use using that filename.
Deploy the vm through the API
Note: Do not power on the VM.
正解:
解説:
See the Explanation for step by step solution
Explanation:
https://portal.nutanix.com/page/documents/kbs/details?targetId=kA00e000000LLEzCAO
https://jsonformatter.curiousconcept.com/#
acli net.list (uuid network defult_net)
ncli cluster info (uuid cluster)
Put Call: https://Prism Central IP address : 9440/api/nutanix/v3vms
Edit these lines to fix the API call, do not add new lines or copy lines.
You can test using the Prism Element API explorer or PostMan
Body:
{
{
"spec": {
"name": "Test_Deploy",
"resources": {
"power_state":"OFF",
"num_vcpus_per_socket": ,
"num_sockets": 1,
"memory_size_mib": 8192,
"disk_list": [
{
"disk_size_mib": 51200,
"device_properties": {
"device_type":"DISK"
}
},
{
"device_properties": {
"device_type":"CDROM"
}
}
],
"nic_list":[
{
"nic_type": "NORMAL_NIC",
"is_connected": true,
"ip_endpoint_list": [
{
"ip_type": "DHCP"
}
],
"subnet_reference": {
"kind": "subnet",
"name": "default_net",
"uuid": "00000000-0000-0000-0000-000000000000"
}
}
],
},
"cluster_reference": {
"kind": "cluster",
"name": "NTNXDemo",
"uuid": "00000000-0000-0000-0000-000000000000"
}
},
"api_version": "3.1.0",
"metadata": {
"kind": "vm"
}
}
https://www.nutanix.dev/2019/08/26/post-a-package-building-your-first-nutanix-rest-api-post-request/ Reference
質問 # 17
......
Nutanix NCM-MCI 認定試験の出題範囲:
| トピック | 出題範囲 |
|---|---|
| トピック 1 |
|
| トピック 2 |
|
| トピック 3 |
|
| トピック 4 |
|
| トピック 5 |
|
NCM-MCI問題集最新の練習テストと18独特な解答:https://www.passtest.jp/Nutanix/NCM-MCI-shiken.html
最新Master Level NCM-MCI実際の無料試験解答:https://drive.google.com/open?id=1TQJxThGplsoecozozDOcF048DyzdCFPP