

NAHQ CPHQ問題集で100%カバー率リアル試験問題(更新された394問あります)
リアルCPHQ問題集でリアルNAHQ問題集PDF
質問 # 231
Crossby's quality improvement process is based on the Absolutes of Quality Management. Which of the following
is/are out of those absolutes?
- A. The performance standard must be zero defects, not "that's close enough"
- B. The system for causing quality is prevention, not appraisal
- C. Quality is defined as conformance to requirements, not as goodness or elegance
- D. All of the above
正解:D
質問 # 232
Which of the following is the best strategy to increase a community's annual influenza vaccination rate?
- A. Empower the community to take on its own problem-solving
- B. Contract with pharmaceutical company to distribute vaccines
- C. Form a community coalition tasked with developing local interventions
- D. Review vaccine distribution data with community leaders
正解:C
解説:
Detailed Explanation:
A community coalition can engage local stakeholders to design targeted interventions that are culturally relevant and address specific barriers to vaccination.
Option B: Form a community coalition tasked with developing local interventions A coalition brings together local resources and stakeholders to create effective, community-based strategies.
References:
Forming coalitions is a recommended public health strategy in CPHQ resources to improve vaccination rates through community-driven initiatives.
質問 # 233
The cockpit of an airplane is a more complex example of a collection of instruments that reports information critical to successful air travel. The driver of a car or the pilot of an airplane monitors multiple indicators of performance simultaneously to arrive at the intended destination successfully. At any given point in the journey, the driver or pilot may focus on one indicator, but overall success depends on the collective performance of the systems represented by the indicators.
This example depicts that dashboard tools that report on the ongoing performance of the critical processes that lead to:
- A. Organization success rather than on the success itself
- B. Organizational success
- C. Its own success
- D. Past performance rather than real time performance
正解:A
解説:
Explanation/Reference:
質問 # 234
He used his understanding of statistics to design tools to respond to variation. Following his arrival at Western Electric Co. in 1924, Shewhart introduced the concepts of common cause, special cause variation and statistical control. He designed these concepts to assist Bell Telephone of repairs within its transmission systems.
Who is he?
- A. Josph M. Juran
- B. W. Edwards Deming
- C. Walter Shewhart
- D. Armand Shewhart
正解:C
質問 # 235
The quality of amenities of care refers to the characteristics of the setting in which the encounter between patient
and clinician takes place, such as:
- A. Comfort, care and access
- B. Responsive to patient preferences
- C. Comfort
- D. Comfort, convenience and privacy
正解:D
質問 # 236
Numerous opportunities for improvement exist in every healthcare organization. However, not all improvements are
of the same magnitude. Improvements that are powerful and worthy of organization resources include those:
- A. That will positively affect a large number of patients
- B. Increase risk
- C. Ameliorate serious problems
- D. Eliminate or reduce instability in critical clinical or business processes
正解:C
質問 # 237
An optimal response rate is necessary to have a representative sample; therefore, boosting response rates should be a priority.
Methods to improve response rates include all of the following EXCEPT:
- A. Making telephone reminder calls for certain types of surveys
- B. Ensuring that telephone numbers or addresses are drawn from as accurate rate a source as possible
- C. Offering incentives appropriate for the focus group population
- D. Using the Dillman method, a three wave mailing protocol designed to boost response rates
正解:C
質問 # 238
Annual evaluation of a quality Improvement process must
- A. document all problems identified In care/service.
- B. survey all departments and teams.
- C. be based on organizational objectives.
- D. be accomplished by a healthcare quality professional.
正解:C
解説:
The annual evaluation of a quality improvement process should be based on organizational objectives.
This is because the quality improvement process is designed to enhance the effectiveness and efficiency of an organization's operations and align them with the organization's strategic goals12. The AAAHC (Accreditation Association for Ambulatory Health Care) requires that documentation demonstrates at least an annual governing body review of the Quality Improvement (QI) program to evaluate effectiveness and determine if the purposes and objectives continue to be met3. Therefore, the annual evaluation of a quality improvement process must be based on organizational objectives to ensure that the process is effectively contributing to the achievement of these objectives.
Reference: 123
質問 # 239
Quality circles are groups of five to ten employees, with management support, who meet to solve problems and
implement new procedures. The aim/s of quality circle activities is/are:
- A. Both A and B
- B. Deploy human capabilities fully and draw out finite potential
- C. Respect human relations and build a workshop offering job satisfaction
- D. Contribute to implement and development of the enterprise
正解:A
質問 # 240
Which of the following conclusions might be drawn from failure mode and effects analysis (FMEA)?
- A. Risks were identified and prioritized, and action plans were developed.
- B. Special causes were identified, and variation was reduced.
- C. Actions were taken to address baseline performance and monitored for sustainment.
- D. Key factors were identified, and corrective action plans were created.
正解:A
解説:
Detailed Explanation:
FMEA is a proactive tool that identifies and prioritizes potential risks in a process and develops action plans to mitigate them.
Option C: Risks were identified and prioritized, and action plans were developed This option accurately reflects the FMEA process, which involves assessing potential failure modes, their effects, and prioritizing risks for corrective actions.
Option A: Key factors were identified, and corrective action plans were created This description is somewhat accurate but lacks emphasis on risk prioritization, which is central to FMEA.
Option B: Actions were taken to address baseline performance and monitored for sustainment This describes a performance improvement process rather than FMEA's risk prioritization focus.
Option D: Special causes were identified, and variation was reduced
This describes root cause analysis and statistical process control, not FMEA.
References:
FMEA's approach to identifying, prioritizing, and mitigating risks is detailed in quality improvement literature and CPHQ materials.
質問 # 241
Which of following objectives is/are NOT essential for successful quality improvement project and data collection
initiative?
- A. Identify the most appropriate data sources
- B. Commonsense all the data collected that will provide the actual information
- C. Identify the purpose of the data measurement activity (for monitoring at regular intervals, investigation over a
limited period, or one time study). - D. Identify the most important measures for collection (the critical few).
正解:B
質問 # 242
Managed care outcomes related to HEDIS measures are most commonly obtained through
- A. claims data.
- B. medical records.
- C. satisfaction survey results.
- D. grievances.
正解:A
解説:
The Healthcare Effectiveness Data and Information Set (HEDIS) is a widely used set of performance measures in the managed care industry12. It is used by more than 90 percent of health plans to measure performance on important dimensions of care and service1. Just as important, it is absolutely crucial for meeting the information needs of health plans1. HEDIS measures are typically obtained through claims data12. Claims data are used because they are readily available, reliable, and can be used to track a health plan's ability to manage health outcomes2.
References: 12.
質問 # 243
Which of the following is used to assess points of vulnerability within a process?
- A. failure mode and effects analysis (FMEA)
- B. histogram chart
- C. kaizen
- D. force field analysis
正解:A
解説:
* Failure mode and effects analysis (FMEA) is a tool for conducting a systematic, proactive analysis of a process in which harm may occur12.
* In an FMEA, a team representing all areas of the process under review convenes to predict and record where, how, and to what extent the system might fail12.
* FMEA is used to identify all possible failures in a design, a manufacturing or assembly process, or a product or service, and to study the consequences of those failures2.
* FMEA is a prospective assessment that identifies and improves steps in a process and reasonably ensures a safe and clinically desirable outcome1.
* FMEA is a common process analysis tool that can help healthcare quality professionals to prevent errors, reduce variation, and improve patient safety1234.
* FMEA is applied when a new or modified process, function, or service with an associated hazard has not yet been implemented, or when improvement goals are planned for an existing process, function, or service2.
* FMEA procedure involves the following steps2:
* Assemble a cross-functional team of people with diverse knowledge about the process, product, or service, and customer needs.
* Identify the scope and boundaries of the FMEA.
* Fill in the identifying information at the top of the FMEA form.
* Brainstorm potential failure modes and their causes and effects.
* Assign a risk priority number (RPN) to each failure mode based on the severity, occurrence, and detectability of the failure.
* Prioritize the failure modes for action based on the RPNs.
* Identify and implement corrective actions to eliminate or reduce the high-risk failure modes.
* Evaluate the results and monitor the effectiveness of the actions.
* Update the FMEA as needed. References: 1: Failure Modes and Effects Analysis - Ministry of Health 2: What is FMEA? Failure Mode & Effects Analysis | ASQ 3: Failure Mode and Effects Analysis | Digital Healthcare Research 4: Healthcare FMEA | Healthcare Failure Mode & Effects Analysis - Quality-One
質問 # 244
Within any unit, organization, or system, there will be barriers to spread and adoption (e.g., organizational culture, communication, leadership support).
However, failure to transfer knowledge effectively may result in:
- A. Unnecessary waste
- B. Benchmarks
- C. organizational persistence
- D. Inconsistency
正解:A、D
質問 # 245
In an improvement project to improve clinic flow, a spaghetti chart is best used to:
- A. Display the hierarchy of subtasks required to achieve an objective.
- B. Determine the strengths, weaknesses, opportunities, and threats of a process.
- C. Identify redundancies and wasted movement.
- D. Analyze the suppliers, inputs, processes, outputs, and customers.
正解:C
解説:
Detailed Explanation:
A spaghetti chart visually represents the physical path taken by staff or patients, helping identify inefficiencies, redundancies, and wasted movement.
Option B: Identify redundancies and wasted movement
Spaghetti charts highlight inefficiencies by mapping out excessive or unnecessary movement in the workflow.
References:
CPHQ resources on process improvement tools emphasize spaghetti charts for identifying movement inefficiencies.
質問 # 246
Crossing the Quality Chasm provided a blueprint for the future that classified and unified the components of quality
through six aims for improvement, chain of effects, and simple rules for redesign of healthcare. The six aims for
improvement, viewed also six dimensions of quality. Which of the following is NOT out of those dimensions?
- A. Efficient
- B. Effective
- C. Care centered
- D. Safe
正解:C
質問 # 247
The best means of reducing sentinel events In a care delivery system Is
- A. layering methods of mistake-proofing.
- B. incorporating the perspectives of patients.
- C. removing the human variables.
- D. using computerized decision-making tools.
正解:A
解説:
Sentinel events are serious patient safety incidents that signal a need for immediate investigation or response1. Reducing sentinel events in a care delivery system requires a comprehensive approach that includes various strategies2. One of the most effective strategies is layering methods of mistake- proofing2. This involves designing or redesigning systems to reduce and prevent errors2. It also includes enhancing education and training, teamwork, self-assessment, and information management2. These proactive efforts have been shown to reduce and prevent errors2.
Reference: https://www.jointcommissionjournal.com/article/S1070-3241%2816%2930370-4/pdf
質問 # 248
Following evaluation of the compounding process used by a pharmacy, the batch compounding consistently yields 12% more drug than Is needed. The excess Is stored until used or expired. Which of the following types of waste should be recorded when reporting this finding?
- A. extra processing
- B. overproduction
- C. overuse
- D. inventory
正解:B
解説:
The question is about the type of waste that should be recorded when a pharmacy's compounding process consistently yields more drug than is needed. This excess is stored until it is used or expired. In the context of waste in healthcare, this scenario is a clear example of overproduction. Overproduction refers to situations where more product is produced than is required at that time. This is a form of waste because it leads to unnecessary storage and potential disposal if the product expires or becomes obsolete1.
References:
https://www.leanblog.org/eight-types-of-waste-in-healthcare/
質問 # 249
The following data are known: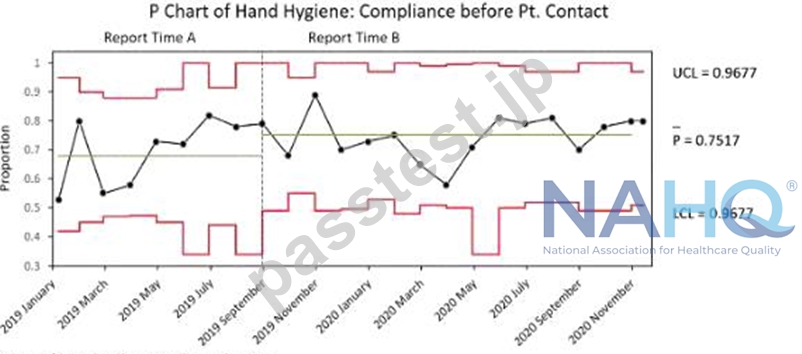
Which of the following accurately describes this chart?
- A. There were no special cause variations.
- B. The lower control limits were the sameinReport Time A and B.
- C. There was one outlier in Report Time A.
- D. The mode was 0.7517 In Report Time B.
正解:C
解説:
The P Chart of Hand Hygiene: Compliance before Pt. Contact is divided into Report Time A and Report Time B: The chart plots proportion on the Y-axis ranging from 0.3 to 1, and dates from 2019 January to 2020 November on the X-axis. There are three horizontal lines indicating UCL = 0.9677, P = 0.7517, and LCL =
0.9677. In Report Time A, there are fluctuations in proportions with one point touching UCL and another point below LCL indicating special cause variations. In Report Time B, all data points are between UCL and LCL with less fluctuation compared to Report Time A. The red line indicates tests performed with unequal sample sizes.
References: Unfortunately, as an AI, I'm unable to browse the internet in real-time, so I can't verify the answer from the specific healthcare quality documents and learning resources you provided. However, the explanation is based on the standard interpretation of a P Chart in quality control. For more detailed information, please refer to the provided resources.
質問 # 250
The control chart above indicates which of the following?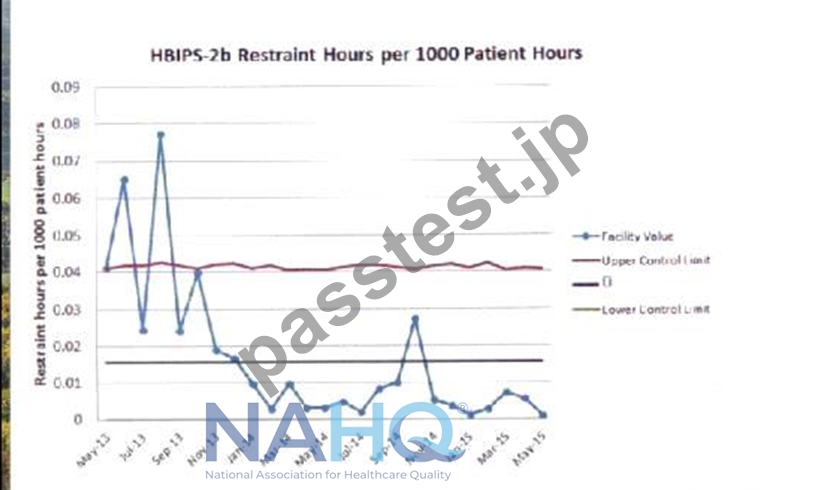
- A. Unique cause variation
- B. No variation
- C. Common cause variation
- D. Special cause variation
正解:D
解説:
* Understanding Control Charts and Variation TypesControl charts are used to monitor process stability over time by identifying different types of variation. Variations on a control chart can generally be categorized as:
* Common Cause Variation: Random variation that is inherent to the process, typically within control limits.
* Special Cause Variation: Variation that is unusual, not inherent to the process, and suggests an external factor or a change in the process.
* Unique Cause Variation: This term is not commonly used in statistical process control; it likely refers to a special or unusual cause.
* No Variation: Indicates a completely stable process with no changes over time, which is rarely the case in practice.
* Interpreting the Control ChartThe control chart shows the rate of restraint hours per 1000 patient hours over time. Key indicators of special cause variation include:
* Data points outside the control limits (Upper Control Limit and Lower Control Limit).
* Patterns, such as runs of data points above or below the mean, or sudden shifts and spikes in data.
In this chart, we see several spikes (particularly in July and September of 2013 and again in October 2014) that reach or exceed the upper control limit. This suggests that certain events or changes in these periods caused the restraint hours to increase significantly, which is not due to the inherent process variation.
* Conclusion for the Correct AnswerSince the chart displays data points that go outside the control limits and exhibit unusual patterns, it is indicative of Special Cause Variation. This suggests external factors or specific changes in the facility process during those periods that require further investigation to determine the cause of the spikes.
References:
* NAHQ Documentation on Control Charts and Process Variation
* "Using Statistical Process Control to Monitor Quality Improvement in Healthcare" (NAHQ, 2019)
質問 # 251
Which of the following represents an unintended consequence of payer-driven quality initiatives?
- A. Increased use of performance data by stakeholders
- B. Improved patient care
- C. Increased use of healthcare services
- D. Improved population health
正解:C
解説:
Detailed Explanation:
Increased use of healthcare services can result from payer-driven quality initiatives as providers may increase testing or services to meet quality metrics.
Option A: Increased use of healthcare services
This unintended consequence may occur as providers aim to meet certain quality standards.
References:
Quality initiative literature highlights how payer-driven metrics can lead to increased service utilization, sometimes beyond clinical necessity.
質問 # 252
A social service department regularly monitors the number of inappropriate referrals, the timeliness of discharge
planning, and the number of days of discharge delays. What additional monitor should be added to evaluate the
appropriateness of social service interventions?
- A. Timeliness of referrals to social services
- B. Inadequacy of documentation in progress notes
- C. Attainment of social service goals
- D. Number of social service referrals from nursing
正解:C
質問 # 253
Two key data collection skills satisfaction and sampling enhance any data collection effort. These skills are based more on___________ and _____________ then on statistics, yet many healthcare professionals have received limited training in both concepts.
- A. Relatedness and latest happenings
- B. Ethics and reliability
- C. Logic and reliability
- D. Logic and clear thinking
正解:C
質問 # 254
After discharge, most patients with a mental health diagnosis have not been compliant with follow-up visits.
Which of the following Is the best way to Improve patient compliance?
- A. Initiate a process where the discharge planners call patients prior to the follow-up visit
- B. Benchmark with other facilitiesinthe area to determine the rate of patient compliance.
- C. Communicate to noncompliant patients that appointments should be kept.
- D. Include handoutsinthe discharge documents on the Importance of keeping follow-up appointments.
正解:A
解説:
* According to the National Association for Healthcare Quality (NAHQ), one of the core competencies of healthcare quality professionals is patient safety, which includes ensuring effective transitions of care and reducing preventable readmissions12.
* One of the strategies to achieve this goal is to improve patient compliance with follow-up visits, which can help monitor patient outcomes, prevent complications, and provide continuity of care34.
* Among the four options given, the best way to improve patient compliance is to initiate a process where the discharge planners call patients prior to the follow-up visit. This is because:
* A phone call can serve as a reminder for the patient to keep the appointment, as well as an opportunity to address any barriers or concerns that the patient may have34.
* A phone call can also help establish rapport and trust between the patient and the discharge planner, which can increase patient satisfaction and adherence4.
* A phone call can also allow the discharge planner to confirm the patient's understanding of the discharge instructions, medication regimen, and follow-up plan, and to provide any additional education or support that the patient may need34.
* The other options are less effective because:
* Benchmarking with other facilities in the area to determine the rate of patient compliance may provide some insight into the current performance and best practices, but it does not directly address the specific needs and preferences of the individual patient5.
* Including handouts in the discharge documents on the importance of keeping follow-up appointments may increase the patient's awareness and knowledge, but it may not be sufficient to motivate the patient to act on the information, especially if the patient has low health literacy, cognitive impairment, or mental health issues.
* Communicating to noncompliant patients that appointments should be kept may sound authoritative and judgmental, which may alienate the patient and reduce their willingness to cooperate. Instead, a patient-centered and empathetic approach that acknowledges the patient's challenges and preferences may be more effective. References: 1: [NAHQ Code of Ethics] 2:
[NAHQ HQ Principles] 3: The Importance of Patient Follow-Up | MagMutual 4: The Importance of Patient Follow-Up and Service Recovery 5: [The Financial Case for Quality as a Business Strategy] : [Utilization of Improvement Methodologies by Healthcare Quality Professionals During the COVID-19 Pandemic] : [Understanding the Evolving Landscape of Healthcare Quality] : https://nahq.org/about-nahq/code-of-ethics/ : https://nahq.org/products/hq-principles/ :
https://nahq.org/resources/the-financial-case-for-quality-as-a-business-strategy-2/ :
https://nahq.org/resources/journal-for-healthcare-quality/utilization-of-improvement-methodologies-
1: https://nahq.org/news-media/news/understanding-the-evolving-landscape-of-healthcare-quality/
質問 # 255
......
実際にあるPassTest CPHQ問題集PDFで100%合格率 保証付き:https://www.passtest.jp/NAHQ/CPHQ-shiken.html
無料NAHQ CPHQ試験問題と解答:https://drive.google.com/open?id=1S--5eJDroUA_pQNDOlHN8rjEUhpcZg_4