![]()
[2024年更新]合格できるTableau TDA-C01試験最新66問題
ゲット2024年最新の無料Tableau TDA-C01試験問題 アンサー
TDA-C01 資格認定は、データ解析における卓越性の基準として、世界中の雇用主によって認められています。これは、Tableau の製品を使用してデータを分析し、実行可能な洞察を作成する知識とスキルを持つことを示しています。認定を受けた専門家は、非認定の専門家よりも高い給与を期待でき、より多くの就職機会があります。また、この認定は、Tableau Certified Associate や Tableau Certified Professional といった高度な Tableau 認定への道を提供します。
Tableau TDA-C01認定試験では、データの準備、データ分析、データの視覚化、ダッシュボードの作成など、幅広いトピックをカバーしています。候補者は、データ分析の概念、データ視覚化のベストプラクティス、およびTableauプラットフォームをよく理解することが期待されています。また、この試験では、候補者がさまざまな種類のデータを分析し、洞察を伝えるための効果的な視覚化を作成する能力をテストします。
質問 # 23
You create a parameter named Choose Region fiat contains values from a field named Region.
You want users to be able to use the Choose Region parameter to interact with a chart by logging between different regions What should you do next?
- A. Set the Choose Region parameter to Single Value (list)
- B. Add Region to me Fitters card
- C. Add the [Region] = [choose Region) formula to the Filters card
- D. Add the Choose Region parameter to the Pages card
正解:C
解説:
To use the Choose Region parameter to interact with a chart by toggling between different regions, you should add the [Region] = [Choose Region] formula to the Filters card. This formula will create a boolean filter that returns TRUE if the value in the Region field matches the value in the Choose Region parameter, and FALSE otherwise. You can add this formula to the Filters card by right-clicking on it and selecting Add Filter from the menu. Then you can select Condition from the dialog box and enter the formula in the text box. This will filter the chart to show only the data for the selected region.
The other options are not correct for this scenario. Adding Region to the Filters card will create a categorical filter that shows a list of values from the Region field, but it will not use the Choose Region parameter. Adding the Choose Region parameter to the Pages card will create a page control that allows you to cycle through different values of the parameter, but it will not filter the chart. Setting the Choose Region parameter to Single Value (list) will change how the parameter control appears on the worksheet, but it will not affect how it interacts with the chart. Reference: https://help.tableau.com/current/pro/desktop/en-us/parameters.htm https://help.tableau.com/current/pro/desktop/en-us/filtering.htm https://help.tableau.com/current/pro/desktop/en-us/filtering_condition.htm
質問 # 24
You have the Mowing two tables that contains data about the books in a library.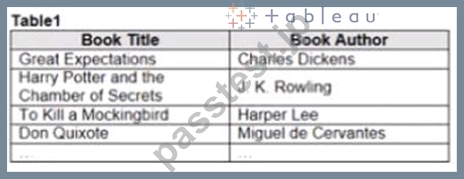
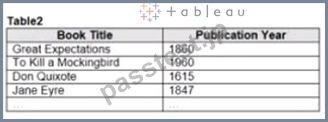
Both tables are incomplete so there are books missing from the tables.
You need to combine the tables. The solution must ensure that all the data is retained Which type of join should you use?
- A. Full outer join
- B. left join
- C. Right join
- D. Inner join
正解:D
質問 # 25
Open the link to Book1 found on the desktop. Use the Superstore data source.
Split the Customer Name field into two fields named First Name and Last Name.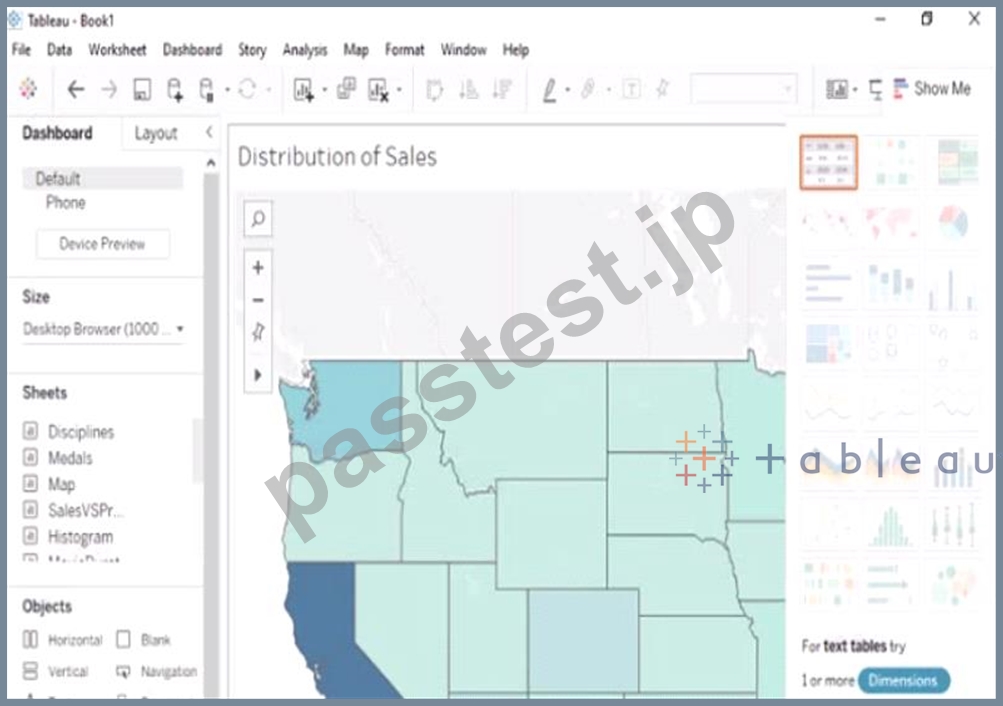
正解:
解説:
Send us your feedback on it
質問 # 26
You have the following dataset.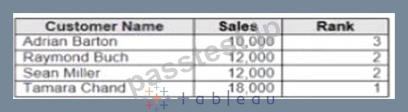
Yon need to calculate the ranking shown in the Rank field.
How should you complete the formula? (Use the dropdowns in the Answer Area to select the correct options to complete the formula ?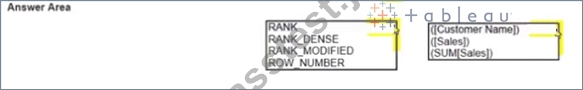
正解:
解説: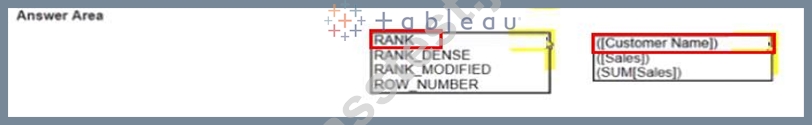
質問 # 27
You company has two divisions located in the United States and Germany Bach division has a separate database. The following is a sample of the sales data for the division in the United States.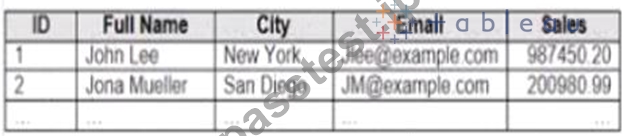
The following is a sample of the sales data for me division in Germany.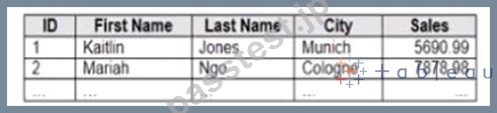
You have population data in a file named Populatio.csv. the following is a sample of the data.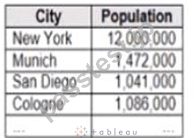
You plan to create a visualization that ml show tie sales per capita for each salesperson Each salesperson must be identified by identified by their full name.
You need to prepare the data to support the planned visualization. The data source must support being published .
Which four actions should you perform in order?
(Place the four correct options n order Use the arrows to move Options to Answer Area arrows to re-order the options.
Use Answer Area arrows to re-order the options)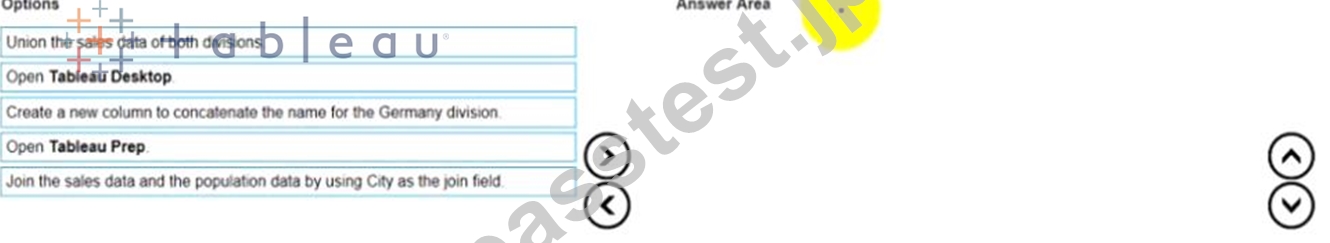
正解:
解説: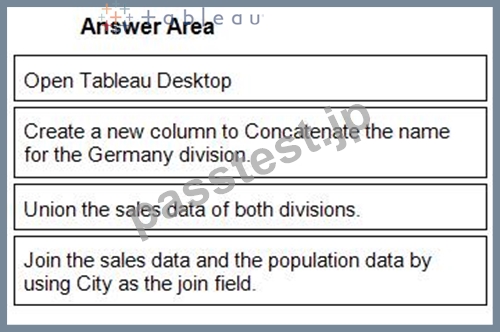
1 - Open Tableau Desktop
2 - Create a new column to Concatenate the name for the Germany division.
3 - Union the sales data of both divisions.
4 - Join the sales data and the population data by using City as the join field.
質問 # 28
You conned to a Microsoft SQL Server database
You need to create a custom SQL query that retrieves rows from a table named Students Only students m the city of Berlin must be returned How should you complete the query? (Drag the appropriate Options to the Answer Area and drop into the correct locations.)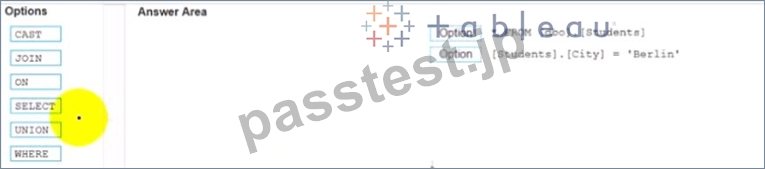
正解:
解説: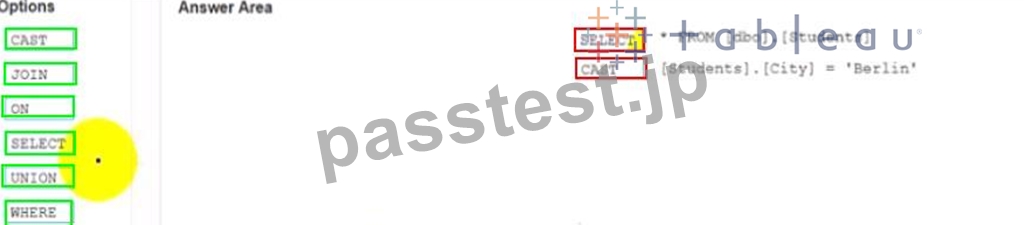
質問 # 29
You have the following dashboard.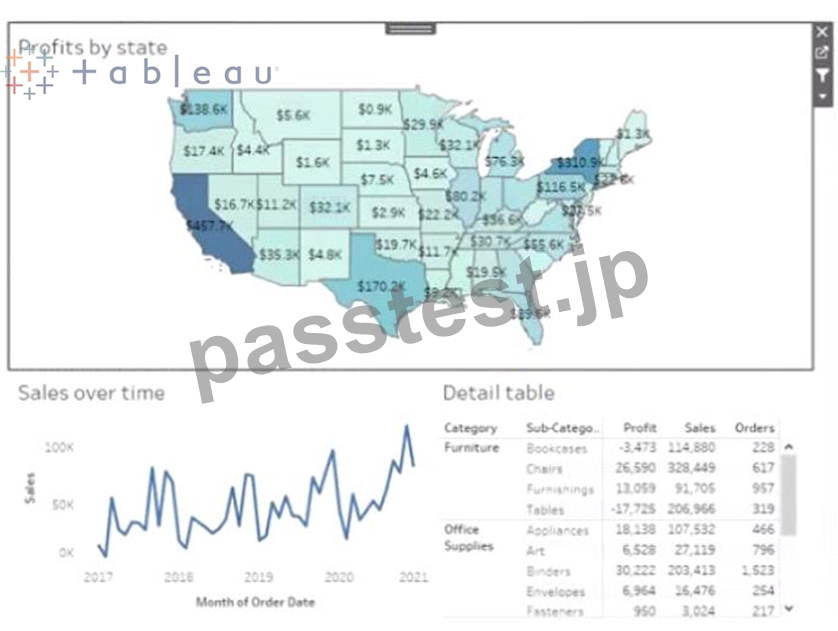
Currently the map is used as a filter that affects the data on the otter sheets of the dashboard You need to configure the dashboard to ensure that selecting a data point on the map only tillers the Detail table What should you do?
- A. From the context menu of Sales over time select Deselect
- B. From the context menu of Profits by Stale deselect Use as Filter
- C. From the context menu of Sales over time select Ignore Actions
- D. From the context menu of Sales over lime select Remove Dashboard Item
正解:D
質問 # 30
You have the following dataset.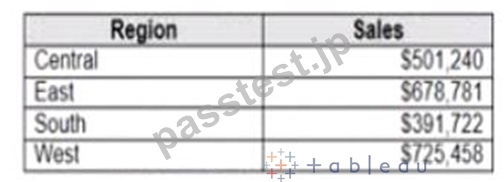
Which Level of Detail (LOD) expression should you use to calculate tie grand total of all the regions?
- A. {FIXED: [Region] SUM Sales}
- B. {FIXED: SUM Sales}
- C. {FIXED: TOTAL (Sales)}
- D. {Fixed: [Region]: TOTAL Sales}
正解:D
質問 # 31
You conned to a Microsoft SQL Server database
You need to create a custom SQL query that retrieves rows from a table named Students Only students m the city of Berlin must be returned How should you complete the query? (Drag the appropriate Options to the Answer Area and drop into the correct locations.)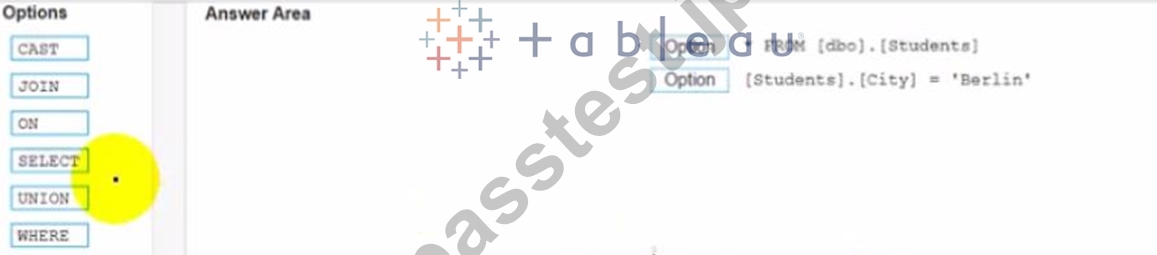
正解:
解説: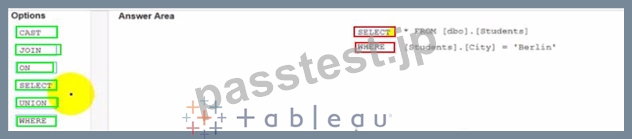
質問 # 32
Open the link to Book1 found on the desktop. Use the Superstore data source.
Split the Customer Name field into two fields named First Name and Last Name.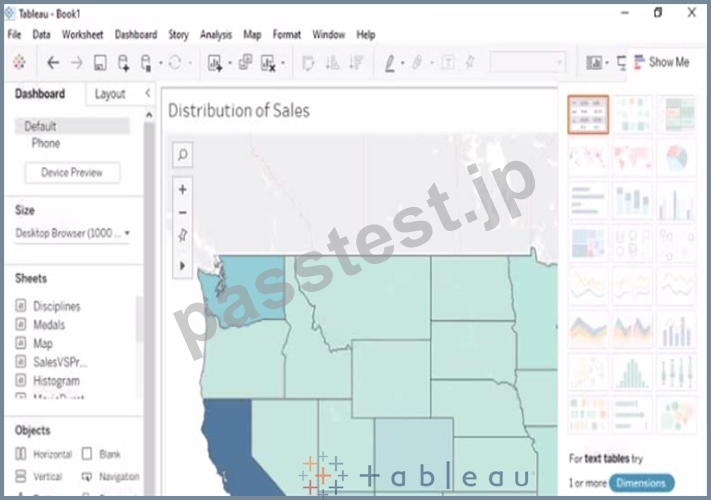
正解:
解説:
check the steps below in explanation
Explanation:
To split the Customer Name field into two fields named First Name and Last Name, you need to do the following steps:
Open the link to Book1 found on the desktop. This will open the Tableau workbook that uses the Superstore data source.
Go to the Data Source tab at the bottom of the workbook to see the data source page. You will see a table that shows the fields and values from the Superstore data source.
Right-click on Customer Name in the table and select Split from the menu. This will split the field into two fields based on a separator, which is a space by default. You will see two new fields named Customer Name - Split 1 and Customer Name - Split 2 in the table.
Right-click on Customer Name - Split 1 and select Rename from the menu. Type First Name as the new name and press Enter. This will rename the field as First Name.
Right-click on Customer Name - Split 2 and select Rename from the menu. Type Last Name as the new name and press Enter. This will rename the field as Last Name.
質問 # 33
You have the following dataset.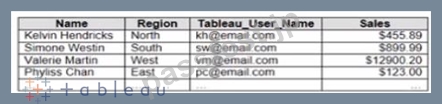
You plan to create a dashboard that will be filtered to show only data that is relevant to a specific Tableau user based on the Tableau_User_Name field You need to create a boolean calculated field to place on the data source finer Which formula should you use for the filter?
- A. ISFULLNAMETableu_USER_NAME))=USERNAME()
- B. NAMEUSERNAME()
- C. NAME Tableau-USER-NAME)
- D. USERNAME()=(Tableau_USER_NAME)
正解:D
解説:
To create a boolean calculated field to place on the data source filter, you should use the formula USERNAME() = [Tableau_user]. This formula will return TRUE if the current Tableau user name matches the value in the Tableau_user field, and FALSE otherwise. You can use this formula as a data source filter by dragging it to the Filters shelf and selecting TRUE from the menu. This will filter the data to show only the rows that are relevant to the specific Tableau user.
The other options are not correct for this scenario. NAME([Tableau_user]) is not a valid function in Tableau. ISFULLNAME([Tableau_user]) = USERNAME() is not a valid expression in Tableau. 'S' + STR([Sales]/1000) is not a boolean expression, but a string expression that converts sales to thousands with a prefix of "S". Reference: https://help.tableau.com/current/pro/desktop/en-us/filtering_datasource.htm https://help.tableau.com/current/pro/desktop/en-us/functions_functions_logical.htm#USERNAME https://help.tableau.com/current/pro/desktop/en-us/calculations_calculatedfields.htm
質問 # 34
You have the following dashboard.
Currently the map is used as a filter that affects the data on the otter sheets of the dashboard You need to configure the dashboard to ensure that selecting a data point on the map only tillers the Detail table What should you do?
- A. From the context menu of Sales over time select Deselect
- B. From the context menu of Profits by Stale deselect Use as Filter
- C. From the context menu of Sales over time select Ignore Actions
- D. From the context menu of Sales over lime select Remove Dashboard Item
正解:C
質問 # 35
You have the following tiled dashboard that has one sheet.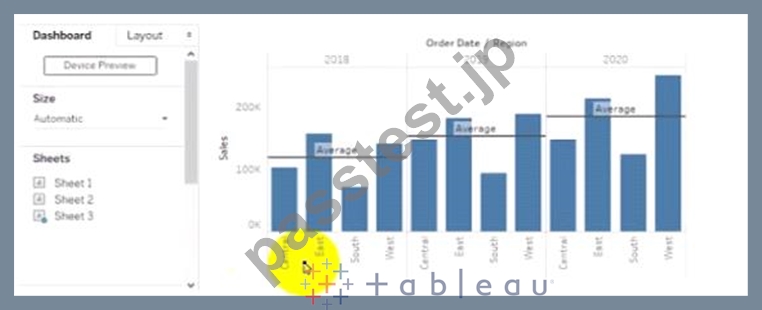
You want to replace fit sheet with Sheet2.
What should you do?
- A. Select Sheets and click the Swap Sheet button next to Sheet2.
- B. Drag Sheet2 to the dashboard.
- C. From the context menu of Sheet3. select Deselect
- D. Right-click Sheet2 and select Add to Dashboard.
- E. From the context menu of Sheet3. select Remove Dashboard item
正解:D
質問 # 36
in which throe formats can you export a worksheet from the Worksheet menu? Choose three
- A. .html
- B. .txt
- C. .pptx
- D. .csv
- E. .xlsx
- F. .png
正解:A、B、D
質問 # 37
You create a parameter named Choose Region fiat contains values from a field named Region.
You want users to be able to use the Choose Region parameter to interact with a chart by logging between different regions What should you do next?
- A. Set the Choose Region parameter to Single Value (list)
- B. Add the [Region] = [choose Region) formula to the Filters card
- C. Add the Choose Region parameter to the Pages card
- D. Add Region to me Fitters card
正解:D
質問 # 38
You have the following bar chart.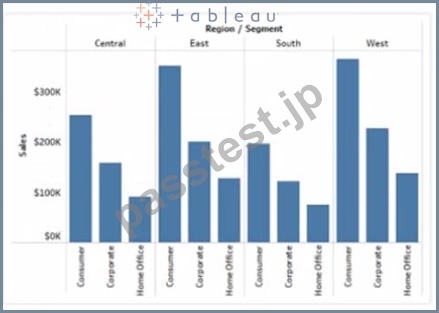
You want the chart to appear as shown in the Mowing exhibit.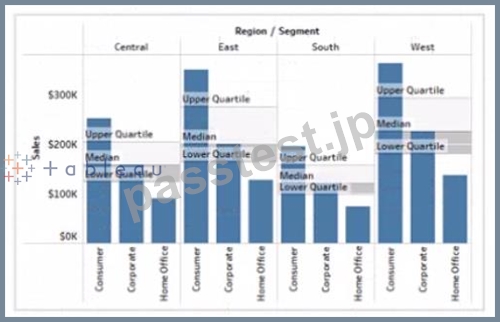
What should you add?
- A. A reference band
- B. A reference line
- C. A distribution band
- D. An average line
正解:A
解説:
A reference band is a shaded area that shows a range of values on an axis. You can use a reference band to highlight a target range, a confidence interval, or a standard deviation. In this case, you want to add a reference band that shows the range of values from 0 to 100 on the y-axis. This will create a shaded area behind the bars that indicates the percentage of sales.
To add a reference band, you need to do the following steps:
Click on the Analytics tab on the left side of the workbook to open the Analytics pane. You will see a list of analytical objects that you can drag and drop onto your worksheet.
Drag Reference Band from the Analytics pane to Y-Axis on the worksheet. This will add a reference band on the y-axis that shows the average and confidence interval for all values.
Click on the Edit button on the reference band to open the Edit Reference Band dialog box. You will see options to customize your reference band.
Change the Band From value to 0 and the Band To value to 100. This will change the reference band to show the range of values from 0 to 100 on the y-axis.
Click OK to apply the changes. You will see that the reference band now shows a shaded area behind the bars.
質問 # 39
You publish a dashboard tut uses an attract. The extract refreshes every Monday at 10:00.
You need to ensure that the extract also refreshes on the last day of the month at 18:00.
What should you do?
- A. From Tableau Server. select Schedules find the schedule of the extract, and change the frequency to the Last day of the month
- B. From Tableau Server select the workbook select Refresh Extracts and then add a new extract refresh
- C. From Tableau Desktop, open the Publish Workbook dialog box and configure the schedule.
- D. From Tableau Server. select Schedules and change the priority of the existing schedule
正解:A
質問 # 40
Open the link to Book1 found on the desktop. Open Disciplines worksheet.
Filter the table to show the Top 10 NOC based on the number of medals won.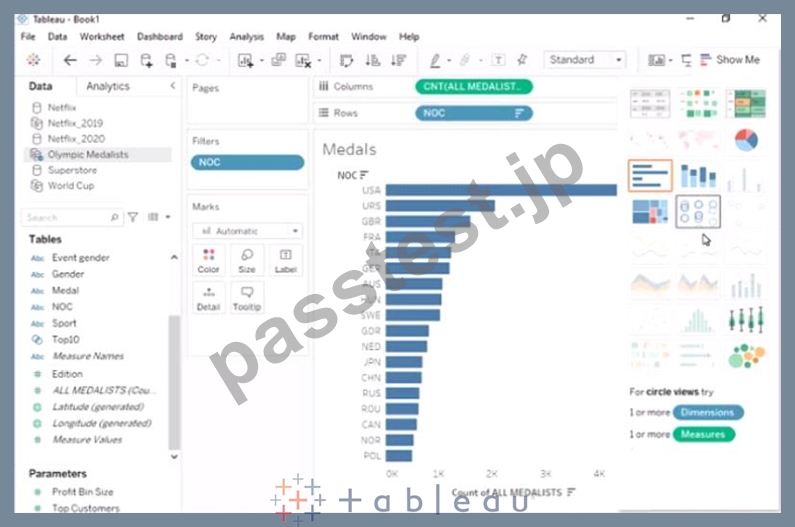
- A. Send us your
- B. Send us your feedback on it.
正解:B
質問 # 41
......
Tableau TDA-C01認定は、Tableauを使用したデータ分析と視覚化の専門知識のベンチマークとして広く認識されており、さまざまな業界の雇用主によって高く評価されています。この認定は、データアナリストが仲間と差別化し、Tableauを使用して複雑なデータセットを視覚化および分析する習熟度を実証するのに役立ちます。また、自分の専門的なスキルと知識を検証および強化し、データ分析の最新のトレンドとベストプラクティスを最新の状態に保つ優れた方法です。
高合格率TDA-C01テスト問題集解答と正解66問題と回答:https://www.passtest.jp/Tableau/TDA-C01-shiken.html
TDA-C01問題集PDFとテストエンジン試験問題:https://drive.google.com/open?id=107i-ynEWpqX2SIoQRV1kyAkyphEEYy0s